PAX Gold Price Prediction: PAXG Breakout Orderly, Listing: Must Watch?


$PAXG broke out of the range it had been consolidating in through most of July, and the move came alongside news that Orderly Network just listed the token for perpetual trading with up to 10x leverage.
This PAX Gold Price Prediction looks at whether the breakout can hold over the next one to two weeks, with the bullish case staying intact above $3,982, while a close back inside the prior range would put the move back in question.
Here is what the chart, the new listing, and the liquidation data show.
Market data checked on August 6, 2026, at 09:25 IST.
PAX Gold Price Prediction Today: Market Overview
Metric | Value |
Price | $4,253.62 |
Market Cap | $1.88B |
FDV | $1.88B |
24h Volume | $326M+ |
Vol/Mkt Cap (24h) | 17.35% |
Liquidity/Mkt Cap | 1.03% |
Total Supply | 442.21K PAXG |
Max Supply | Uncapped |
Circulating Supply | 442.21K $PAXG |
Holders | 85.43K |
Source: Data from CoinMarketCap as of August 6, 2026, at 09:25 IST. Figures may vary slightly across other tracking websites.
PAX Gold Liquidation and Volume Data
PAX Gold crypto forecast: Liquidations (Futures, Coinglass)
Timeframe | Long | Short | Total |
1h | $4.41K | $0 | $4.41K |
4h | $4.59K | $52.47K | $57.06K |
12h | $6.11K | $92.91K | $99.02K |
24h | $7.17K | $192.17K | $199.34K |
Short positions have taken the overwhelming majority of the damage across every window, which lines up with a breakout squeezing traders who were positioned for the range to hold. 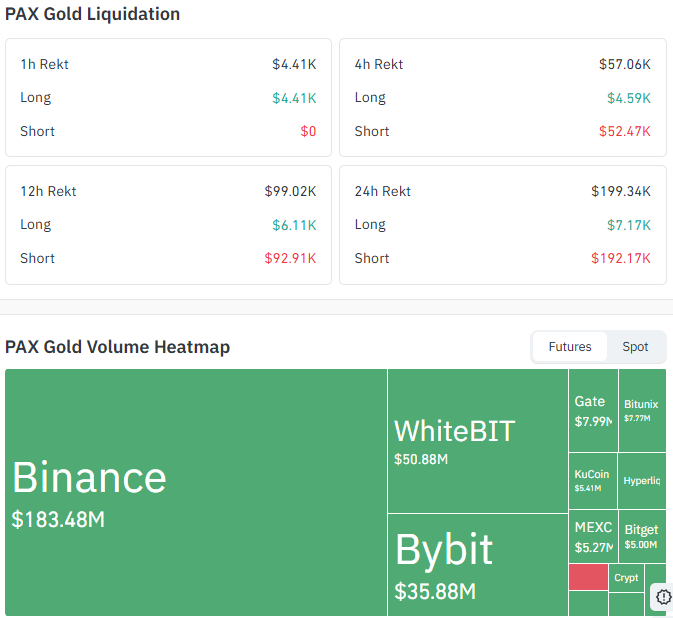
Source: Data From CoinGlass
The 24h short liquidation total of $192.17K against just $7.17K on the long side points to a fairly one-sided move so far.
PAX Gold crypto forecast: Exchange Volume Breakdown (Futures, Coinglass)
Binance leads futures volume at $183.48M, followed by WhiteBIT at $50.88M and Bybit at $35.88M. Smaller venues, including Gate ($7.99M), Bitunix ($7.77M), KuCoin ($5.41M), MEXC ($5.27M), and Bitget ($5.00M), round out the rest of the tracked exchanges.
This futures data is kept separate from the spot volume figure reported in the market overview table above.
PAXG crypto news today: PAXG Orderly Listing: What the News Adds
A post from crypto commentator Joshuwa Roomsburg, reposting an announcement from Orderly Network, states that PAXG and ZHIPU are now live on Orderly with up to 10x leverage, part of a broader push offering over 130 markets for builders launching their own perpetual exchanges. 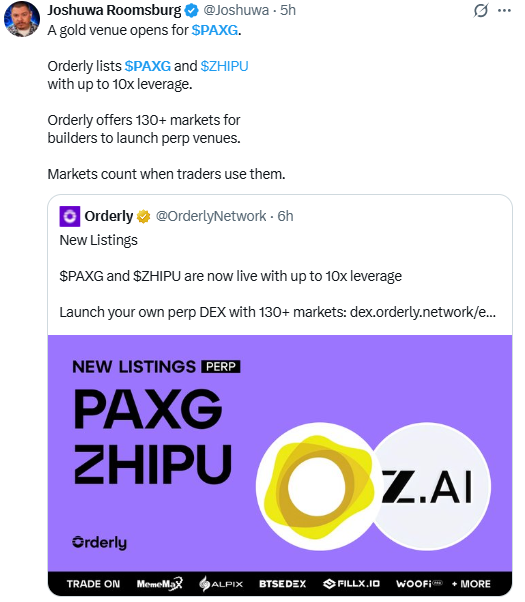
Source: Data From X
NOTE: CoinGabbar could not independently verify trading volume or open interest specific to this new venue at the time of writing, since the screenshots reviewed here come from the announcement post rather than live exchange data.
If confirmed by trading activity in the coming days, a new leveraged venue could add to the short-term volatility already visible in the liquidation numbers above.
PAXG Price Prediction Chart: Technical Analysis
Pair: PAXG/USD · Market: Spot (Crypto) · Timeframe: 1D · Source: TradingView · Timestamp: August 6, 2026, 09:25 UTC+5:30
PAXG is trading at $4,253.62 after pushing out of the tight range it had held through most of July and into early August, roughly between $3,982 and $4,179.
That range had formed after a sharp pullback from the April highs near $4,800, and the last candle broke firmly above the top of it on rising volume.
RSI (Relative Strength Index, a momentum gauge that flags overbought or oversold conditions on a 0 to 100 scale) sits at 64.98, still short of overbought territory, which leaves some room for the move to extend before momentum gets stretched.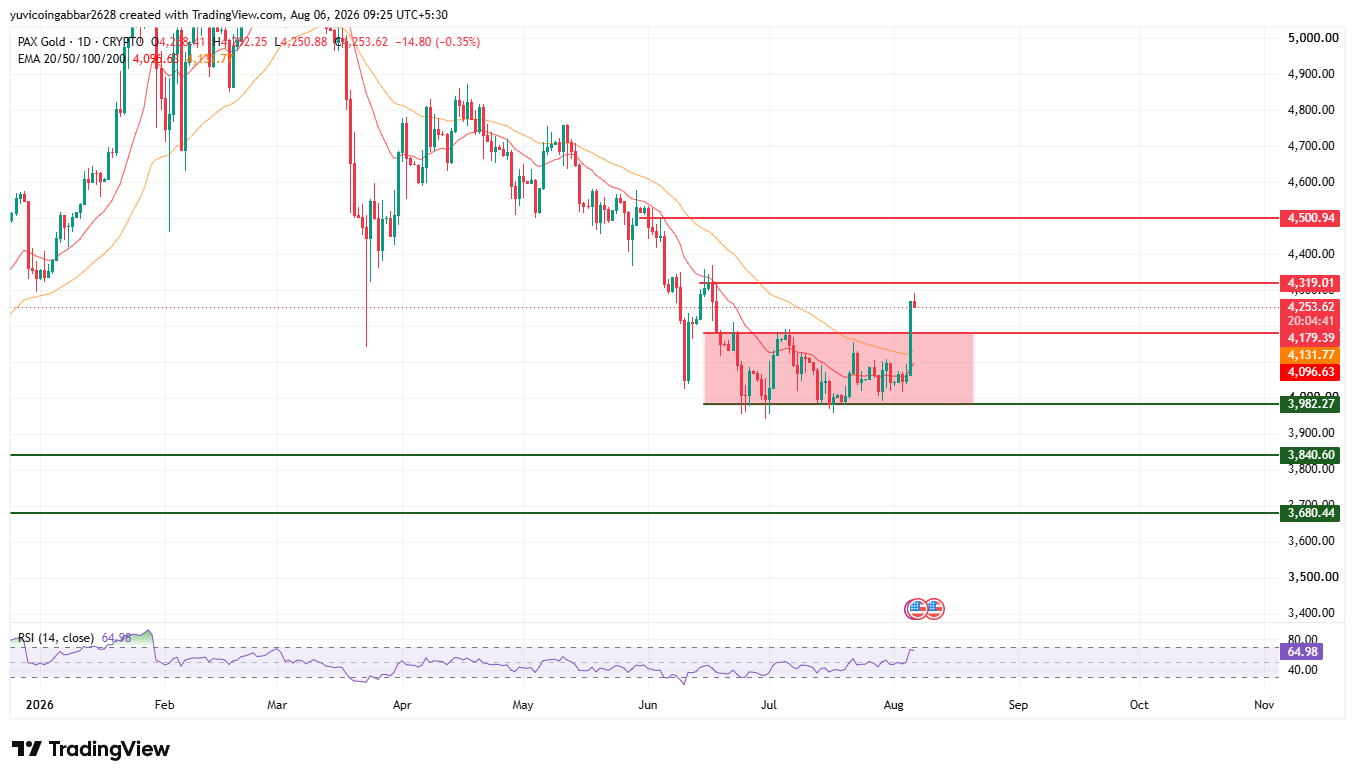
The EMA (Exponential Moving Average, a trend indicator that weights recent price action more heavily) lines on the 20 and 50 EMA are clustered just below the current price; the price is now trading above all after spending weeks stuck beneath them.
If the 20& 50 EMA made a bullish crossover here, that will be the bullish trend confirmation.
Support and Resistance Levels
Level Type | Price |
Resistance 2 | $4,500.94 |
Resistance 1 (nearest) | $4,319.01 |
Immediate Price Reference | $4,253.62 |
First Support (range-based) | $3,982.27 |
Deeper Support | $3,840.60 |
Structural Floor | $3,680.44 |
EMA Levels
EMA | Price |
EMA (20) | $4,096.39 |
EMA (50) | $4,131.77 |
PAXG Forecast: Bull Case vs. Bear Case
PAXG price target 2026 Bull case: Holding above the range base at $3,982 and staying above the EMA cluster near $4,096 to $4,179 would confirm the breakout is holding rather than fading back into the old range.
A confirmed close above the nearest resistance at $4,319 would open the path toward $4,501.
PAXG price target 2026 Bear case: A close back below $3,982 would put the breakout in doubt and suggest the move was a temporary squeeze tied to short liquidations rather than a genuine trend shift.
Losing $3,841 would expose $3,680 as the next downside level.
PAXG price target: Can PAXG Reach $4,500?
$4,500.94 is the highest resistance level marked on the chart.
Getting there would require PAXG to first clear the nearest resistance at $4,319 and hold above the EMA cluster on a closing basis, since a single day's breakout candle is not enough on its own to confirm a sustained move to that level.
What Could Invalidate the PAXG Bullish Setup?
A rejection at the nearest resistance near $4,319 followed by a close back below the EMA cluster and the range base at $3,982 would put the breakout in question.
A deeper break below $3,841 and the structural floor at $3,680 would undermine the recovery structure entirely and point back toward the February to July downtrend.
PAX Gold Price Prediction 2026: Expert View
According to CoinGabbar analysts, The break above a multi-week range on rising volume, paired with a lopsided liquidation picture favoring shorts, points to a squeeze-driven move that still needs confirmation over the coming sessions.
RSI at 64.98 leaves room to run before momentum looks stretched, and the EMA cluster now sitting below price rather than above it is a meaningful shift from the past several weeks of consolidation.
The reported Orderly listing adds a wildcard for near-term volatility, though its actual trading impact remains unverified at this stage.
The $3,982 to $4,319 zone is the range to watch: holding above it keeps the breakout thesis alive, while slipping back under $3,982 would suggest the move was mostly short covering.
PAX Gold Price Prediction: Data Sources
Price, EMA, and RSI data referenced from a 1D PAXG/USD chart via TradingView, timestamped August 6, 2026, 09:25 UTC+5:30.
Market cap, FDV, volume, and supply data referenced from the price tracker snapshot.
Liquidation and futures volume data referenced from Coinglass. Listing news referenced from a public post on X reposting an Orderly Network announcement.
Disclaimer: This piece is for informational purposes only and is not financial advice. The levels and scenarios above are based on technical chart analysis and publicly available data at the time of writing, and crypto markets can move sharply within hours, so past patterns do not guarantee future outcomes. It is worth doing independent research and considering your own risk tolerance before acting on any of the levels discussed here.


















