BNB Price Prediction: 1.62M $BNB Burn, Can Price Hold $537, What Next?


$BNB is one of the biggest names in crypto, and it's not hard to see why.
It's the native token of the BNB Chain ecosystem, originally launched by Binance, and it's used for things like paying trading fees, powering transactions on the network, and fueling a wide range of DeFi and Web3 apps built on top of it.
That wide utility is a big part of why traders keep close tabs on every move BNB makes. That's exactly what this BNB Price Prediction breaks down: what's driving the current move, what the chart is showing, and the levels that matter next.
Stay till the end; there's key info here that could shape your next move.
BNB Price Prediction: Market Overview
| Metric | Value |
| Current Price | $565.09 |
| 7d Change | -2.4% |
| 24h Range | $562.69 – $580.26 |
| Market Cap | $75.197B |
| Fully Diluted Valuation | $75.197B |
| 24h Trading Volume | $593.406M |
| Circulating Supply | 133.166M BNB |
| Total Supply | 133.166M $BNB |
| Max Supply | 200M $BNB |
| Total Treasury Holding | 686,076 $BNB |
Source: Data from CoinGecko
Latest Update: $BNB Chain Leads Tokenized Treasury Growth
BNB Chain's official account highlighted data from Token Terminal showing the network has seen the largest absolute increase in tokenized treasuries of any chain since the start of the year. 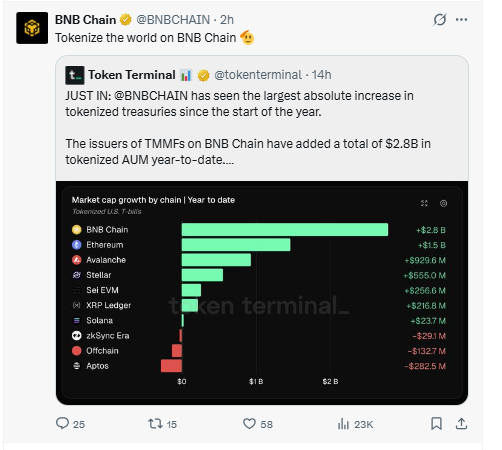
Issuers of tokenized money market funds on $BNB Chain have added $2.8 billion in tokenized assets under management year-to-date, ahead of Ethereum's $1.5 billion and Avalanche's $929.6 million over the same period.
This points to $BNB Chain gaining real traction as infrastructure for real-world asset tokenization, a theme that's been growing across the industry through 2026.
Latest Update: BNB's 36th Quarterly Burn Completed
Separately, BNB Chain confirmed its 36th quarterly token burn took place on July 15, 2026, removing 1.62 million $BNB from the circulating supply. 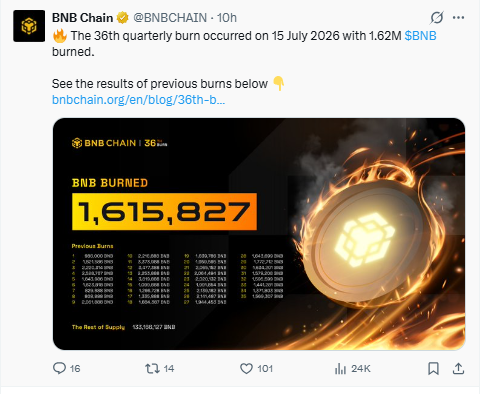
Source: Data from X
This is one of a long-running series of burns the network has carried out to steadily reduce total BNB supply over time, a structural, deflationary factor that supports long-term value even during short-term price pullbacks like the one BNB is currently working through.
BNB Chart Analysis 2026: Trendline Break After a Failed Recovery
BNB dropped sharply from its EMA 200 in early June, then spent close to 10 days trading inside a rising channel as it attempted to recover.
That channel eventually broke down, sending the price to test support around $537.82.
From there, $BNB pushed back up but failed to sustain the move, reversing lower from around $592 before breaking down through the short-term trendline it had been trading along for several days.
Price is now trading around $565.09, just below that broken trendline.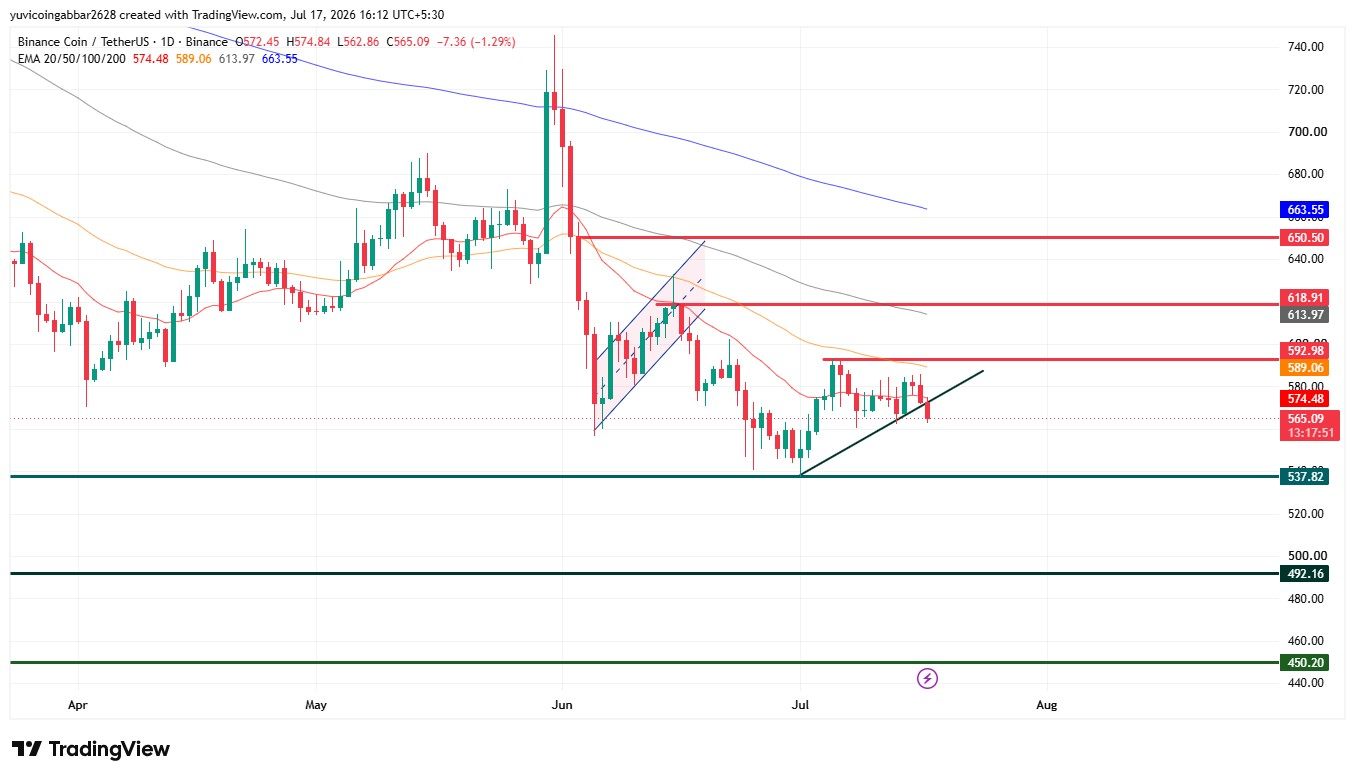
Price is trading below every EMA on this timeframe: EMA 20 at $574.48, EMA 50 at $589.06, EMA 100 at $613.97, and EMA 200 at $663.55.
Having all four EMAs stacked above current price confirms the broader trend remains bearish for now.
How These Levels Were Read
The chart levels below come from a TradingView daily BNB/USDT candlestick chart on Binance, using EMA indicators across the 20, 50, 100, and 200-day periods, alongside horizontal support and resistance zones marked from recent price reaction points.
An EMA, or exponential moving average, tracks the average price over a set number of days and gives more weight to recent price action, which helps show the direction of the broader trend.
These are technical readings based on price history, not fundamental valuations, and should be read alongside the burn and treasury updates above rather than in isolation.
BNB Price Prediction: Key Levels
| Support | Resistance |
| $537.82 | $592.98 |
| $492.16 | $618.91 |
| $450.20 | $650.50 |
Two Scenarios to Watch
Recovery Scenario
If $BNB holds support around $537.82 and stages a genuine recovery, the first real test is $592.98, the same level that already rejected the price once this month.
Clearing that would open the door to $618.91 and eventually $650.50. A rejection at $592.98 again would suggest the broader pullback isn't finished.
Breakdown Scenario
Losing $537.82 would point toward $492.16 as the next level, with $450.20 as a deeper target if selling continues.
Given $BNB's strong underlying fundamentals right now, including the ongoing burn program and treasury growth, a break this deep would likely require broader market weakness beyond BNB-specific factors.
Risk Note
$BNB is a large-cap, established asset, so its volatility profile differs from newer or thinner altcoins, but the current setup still shows price trading below every major EMA after a clear trendline break. These levels should be treated as zones to watch, not guarantees, particularly since strong fundamental news, like the burn and treasury growth here, doesn't always translate into immediate price strength.
BNB Price Prediction: Expert View
According to CoinGabbar analysts , $BNB's chart and fundamentals are currently telling two different stories.
The burn program and $BNB Chain's lead in tokenized treasury growth both support a constructive long-term case, while the recent trendline break and price sitting below every EMA point to near-term weakness.
Holding $537.82 keeps the broader structure intact, with $592.98 as the level that needs to break for a genuine recovery. Losing $537.82 would shift focus toward $492.16.
Disclaimer: This is a technical read based on current chart structure and should not be treated as financial advice. Crypto markets are highly volatile, and prices can move sharply in either direction with little warning. Always do your own research before making any investment decision.
Also read:
2 months ago
How to Hire a Hacker to Recover Stolen Bitcoin ; META TECH RECOVERY PRO Top Crypto Recovery Expert in USA Meta Tech Recovery Pro was founded to help victims of crypto theft, cryptocurrency scams, and wallet loss recover their digital assets. We recognize that being defrauded is often accompanied by stress, uncertainty, and long-term disruption, and we approach each case with seriousness, discretion, and measurable progress. Our team combines experienced crypto recovery professionals with blockchain forensics specialists. Using systematic analysis of transaction histories, blockchain patterns, and relevant on-chain and off-chain activity, we trace where stolen funds moved, how wallet access was compromised, and what technical pathways may support restoration. This may include tracing suspicious transfers, mapping associated addresses, evaluating links to exchanges or custodial services, and determining recovery options based on the incident’s specific facts. Reach out to them via the following: - Support (@) metatechrecoverypro (.) com - https://wa.link/5ay4fv - - https://metatechrecoverypro (.) com We emphasize legitimacy, transparency, and responsible practice. Effective recovery requires both technical capability and ethical standards; therefore, we use structured procedures rather than unverifiable promises. We provide victims with clarity on what can be pursued and realistic outcomes, guided by evidence rather than marketing claims. Our services cover: - Lost access to a Bitcoin wallet (forgotten credentials, missing seed phrases, compromised devices, inaccessible keys). - Fraud from romance scams, where attackers manipulate victims into sending cryptocurrency while sustaining deceptive trust. - Defrauding via counterfeit or fake investment platforms, including impersonation of legitimate projects, promises of high returns, and deceptive withdrawal of funds. Timely action is critical, as crypto transactions are often irreversible and stolen funds may be quickly dispersed or converted. We encourage victims to document wallet addresses, transaction IDs, dates, communications, and any platform or contact information as early as possible to enable efficient forensic assessment. Our approach is comprehensive, considering how fraud operates, including tactics used to obscure fund flows, exploit wallet vulnerabilities, or socially engineer victims into approving transfers. By evaluating both behavioral and technical dimensions, we improve the likelihood of locating actionable leads and selecting the most appropriate recovery strategy. Recovery also requires accountability, confidentiality, and a patient, methodical mindset. Whether assets were taken through hacking, misdirection, manipulation, or wallet access loss, our team investigates thoroughly and guides you through the recovery process with professionalism. Meta Tech Recovery Pro is committed to helping victims reclaim what was taken, restore control where possible, and provide informed support throughout a challenging experience.

2 months ago
How to Hire a Hacker to Recover Stolen Bitcoin ; META TECH RECOVERY PRO Top Crypto Recovery Expert in USA Meta Tech Recovery Pro was founded to help victims of crypto theft, cryptocurrency scams, and wallet loss recover their digital assets. We recognize that being defrauded is often accompanied by stress, uncertainty, and long-term disruption, and we approach each case with seriousness, discretion, and measurable progress. Our team combines experienced crypto recovery professionals with blockchain forensics specialists. Using systematic analysis of transaction histories, blockchain patterns, and relevant on-chain and off-chain activity, we trace where stolen funds moved, how wallet access was compromised, and what technical pathways may support restoration. This may include tracing suspicious transfers, mapping associated addresses, evaluating links to exchanges or custodial services, and determining recovery options based on the incident’s specific facts. Reach out to them via the following: - Support (@) metatechrecoverypro (.) com - https://wa.link/5ay4fv - - https://metatechrecoverypro (.) com We emphasize legitimacy, transparency, and responsible practice. Effective recovery requires both technical capability and ethical standards; therefore, we use structured procedures rather than unverifiable promises. We provide victims with clarity on what can be pursued and realistic outcomes, guided by evidence rather than marketing claims. Our services cover: - Lost access to a Bitcoin wallet (forgotten credentials, missing seed phrases, compromised devices, inaccessible keys). - Fraud from romance scams, where attackers manipulate victims into sending cryptocurrency while sustaining deceptive trust. - Defrauding via counterfeit or fake investment platforms, including impersonation of legitimate projects, promises of high returns, and deceptive withdrawal of funds. Timely action is critical, as crypto transactions are often irreversible and stolen funds may be quickly dispersed or converted. We encourage victims to document wallet addresses, transaction IDs, dates, communications, and any platform or contact information as early as possible to enable efficient forensic assessment. Our approach is comprehensive, considering how fraud operates, including tactics used to obscure fund flows, exploit wallet vulnerabilities, or socially engineer victims into approving transfers. By evaluating both behavioral and technical dimensions, we improve the likelihood of locating actionable leads and selecting the most appropriate recovery strategy. Recovery also requires accountability, confidentiality, and a patient, methodical mindset. Whether assets were taken through hacking, misdirection, manipulation, or wallet access loss, our team investigates thoroughly and guides you through the recovery process with professionalism. Meta Tech Recovery Pro is committed to helping victims reclaim what was taken, restore control where possible, and provide informed support throughout a challenging experience.
















