BNB Price Prediction 2029: Next Bull Run Targets


BNB is trading around $577.8 right now, sitting just below a flip zone that has already played a big role in shaping this chart's story.
Working out where this token could realistically land takes a proper look at how price has behaved around this same zone over the past few years before making any BNB price prediction 2029 call.
$BNB currently ranks 4th among all cryptocurrencies, holding a market cap close to $77.63 billion and a fully diluted value at the same level, out of a total circulating supply of 134,782,184 tokens.
This $BNB coin price prediction takes both the on-chart structure and the broader Binance Coin price forecast landscape into account before laying out any long-term targets.
$BNB Price Right Now
Metric | Value |
$577.8 | |
Market Cap | $77.63B |
24H Volume | $361.55M |
Circulating Supply | 134,782,184 BNB |
Total Supply | 134,782,184 BNB |
BNB Price Prediction 2029: Chart Structure Right Now
On the monthly chart, BNB has been riding a long rising trendline that started forming back in February 2021.
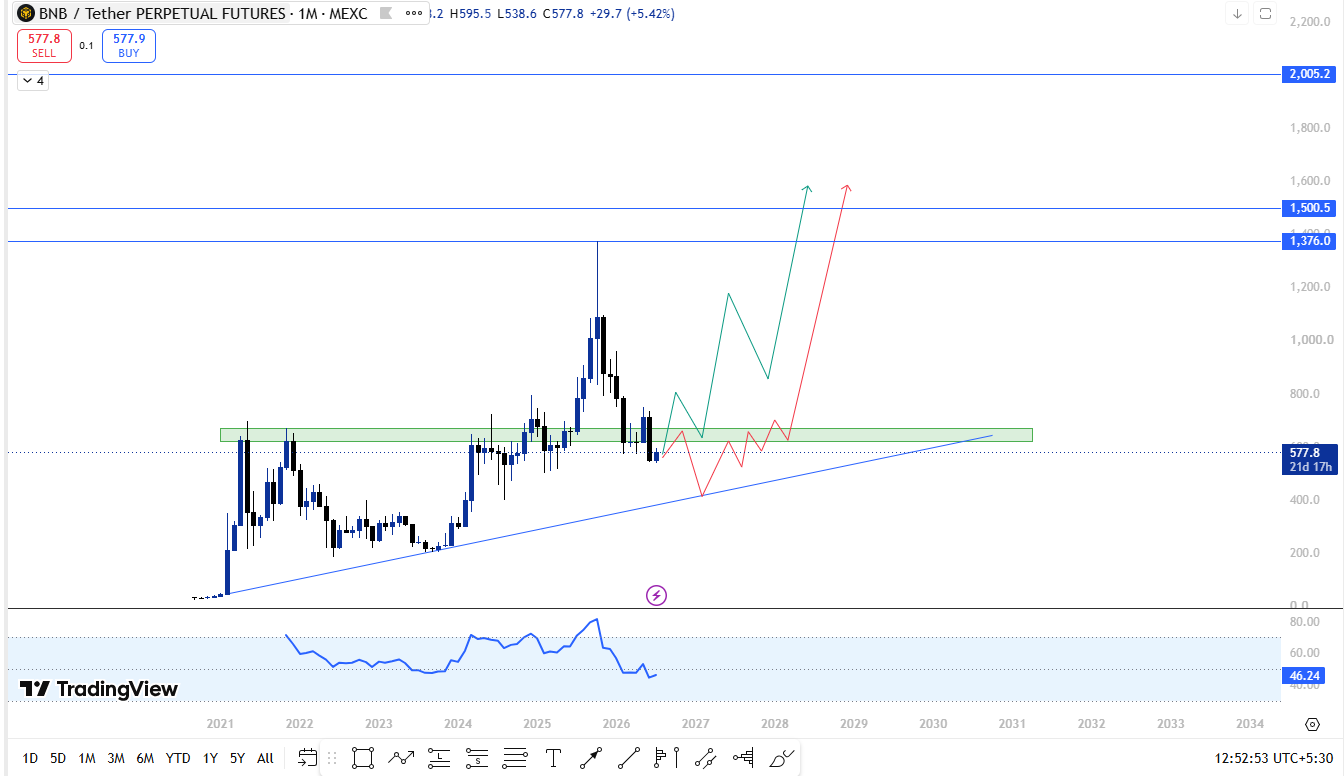
This $BNB technical analysis begins with that same trendline, since it has been the backbone of the entire multi-year structure.
Price came back down and tapped this same trendline a second time in September 2023, and from that point $BNB moved over 500% to the upside.
After that rally, price found its footing in the $622 to $668 flip zone, holding there before breaking out above it.
Once the breakout happened, some selling did follow, but it never turned aggressive enough to break the structure.
Buyers stepped back in and pushed the price all the way to a fresh all-time high.
Right now, $BNB is trading back below that same $622 to $668 flip zone, which puts the market at a point worth watching closely for anyone tracking BNB price analysis today.
What This Setup Means Going Forward
If price makes its way back down to the rising trendline from here and a reversal begins around that zone
The expectation is a similar move to what happened after the last trendline tap in 2023, a strong push back up toward the current all-time high, followed by an attempt at fresh highs beyond it.
Three levels stand out above the current price on the chart, at $1,376.0, $1,500.5, and $2,005. 2.
These become relevant targets once $BNB clears its current all-time high and starts building a new range above it, and they form the basis of this BNB price target outlook heading into the next cycle.
Support and Resistance Levels
The $622 to $668 zone is the key area to watch on the way back down, along with the rising trendline sitting underneath it.
On the upside, the current all-time high is the first hurdle, with $1,376.0, $1,500.5, and $2,005.2 marking the next targets further out.
BNB Price Prediction 2029: Year-by-Year Scenarios
Year | Bearish Target | Bullish Target |
2026 | $500 - $600 | $700 - $900 |
2027 | $600 - $750 | $1,000 - $1,376 |
2028 | $750 - $900 | $1,376 - $1,500 |
2029 | $900 - $1,100 | $1,500 - $2,005 |
Risk Reward Snapshot
Factor | Detail |
Key Support | $622 - $668, Rising Trendline |
Key Resistance | Current ATH, then $1,376.0 - $2,005.20 |
The analysis above combines historical price structure with publicly available market data and should not be treated as a guarantee of future performance.
Is BNB a Good Long-Term Investment
BNB's chart shows a token that has respected its long-term trendline for years now, turning every major tap into the starting point of a strong rally.
With price currently sitting below the $622 to $668 flip zone, a return to the trendline followed by a reversal could set up a similar move to what played out in 2023.
Combined with the steady supply reduction from quarterly auto burns, this keeps the longer-term Binance Coin investment picture constructive heading toward 2029.
Expert View
Sentiment around $BNB has remained fairly steady, with several analysts pointing to its multi-year trendline structure as one of the more reliable technical patterns in the market.
The current retracement below the $622 to $668 zone is being viewed as part of a normal pullback rather than a shift in trend.
Most agree that how price reacts near the rising trendline over the coming months will be the key factor in determining whether $BNB is setting up for its next major leg toward the $1,376 to $2,005 range by 2029 and whether the market finally sees BNB reach $2,000.
Conclusion
BNB's chart comes down to one long-standing structure: the trendline from February 2021 and the $622 to $668 flip zone sitting just above the current price.
As long as this trendline continues to hold on future tests, the setup stays similar to what has played out before, a strong reversal followed by a fresh all-time high and continued upside beyond it.
How $BNB behaves around this trendline over the next few pullbacks will likely decide how the years leading up to 2029 unfold for this BNB coin forecast.
Disclaimer: This article is for informational purposes only and should not be considered financial advice. Cryptocurrency markets are highly volatile, and price predictions are not guaranteed. Please do your own research before making any investment decisions.

















