Bubblemaps Price Prediction: $BMT Breakout Sparks Short Squeeze


A chart-analytics token, a sudden burst of derivatives activity, and a pile of short sellers caught on the wrong side all showed up together this week, and the timing was not subtle. Bubblemaps price prediction searches jumped as BMT tore through a level it had been grinding under for months, and now folks want to know if this move actually sticks. Here's the thing: the chart says one thing on a short timeframe and something calmer on a longer one, and both versions matter.
We pulled the chart data, checked the wallet concentration, and read the liquidation feed so the picture is not just vibes. Does this breakout hold, or is it another leveraged spike waiting to fade?
Why Bubblemaps (BMT) Is Suddenly Everywhere
Bubblemaps price prediction chatter picked up fast once BMT ripped through its descending channel in a single candle. The token had spent months grinding lower, and then volume showed up almost out of nowhere, a setup that shows up often across the wider price prediction coverage whenever a beaten-down token gets a fresh catalyst. And it did not stop at a small pop.
Liquidation data backs that up. Short sellers got run over hard, and that forced buying pushed the candle further than organic demand alone likely would have. Nobody called this move a week ago, and that is worth admitting. Still, once it started, it moved with real conviction, a pattern that also shows up across broader crypto news today whenever a squeeze meets thin liquidity.
Key Takeaways
BMT trades near $0.0401, up about 181% in 24 hours, with market cap near $28.62M.
24-hour volume hit $316.61M, up roughly 8453.92%, against a vol/mkt cap ratio of 1102.02%.
The daily chart shows a descending channel breakout with RSI at 96.14, deeply overbought.
The weekly chart shows a calmer channel breakout with RSI at 72.57, still elevated.
Resistance sits near $0.0452, then $0.0510; support sits near $0.0244, then $0.0109.
Top 10 wallets hold 76.3% of tracked Solana supply, an extreme concentration risk.
Any short-term Bubblemaps price prediction hinges on holding the $0.0244 daily support level.
Why Is BMT Price Pumping Today
A Breakout That Caught Short Sellers Leaning Wrong
BMT broke cleanly above its descending channel on the daily chart in the last session, and the move added over 181% in a day. RSI ripped from the mid-range straight to 96.14 alongside it. That kind of candle rarely happens on low volume. and this one did not, with 24-hour turnover topping $316.61M against a market cap of roughly $28.62M.
Then the Liquidations Piled On
Coinglass shows 24-hour liquidations near $3.26M, and shorts made up $2.21M of that figure, more than double the long side. In just the last hour, shorts alone absorbed $94.33K against $53.82K in longs. Binance alone processed $525.79M of futures volume on the day, with Bybit, Bitunix, and MEXC adding meaningfully behind it. Traders betting against BMT got squeezed out fast, and that is how leverage-driven candles get their extra height.
Macro conditions helped a little too. Progress on the broader Clarity Act Senate vote has kept sentiment constructive this month, and thinner risk aversion tends to lift small-cap altcoins like BMT first when it shows up.
That kind of tailwind matters more than it looks. Broader Fed meeting commentary has leaned toward rate-cut hope, and that backdrop tends to favor exactly this kind of squeeze-driven altcoin move.
Bubblemaps (BMT) Technical Analysis
This Bubblemaps technical analysis breaks the move into two timeframes since the daily and weekly charts tell different stories right now.
Data captured from Binance via TradingView at 19:44 UTC on August 10, 2026.
Short-Term Chart Analysis (Daily)
This Bubblemaps daily chart analysis shows a stretched setup. BMT opened near 0.0330, spiked to a high of 0.0430, and trades at 0.0423, a 27.95% single-day gain. RSI at 96.14 is one of the hottest prints on this timeframe in months, deep inside exhaustion territory.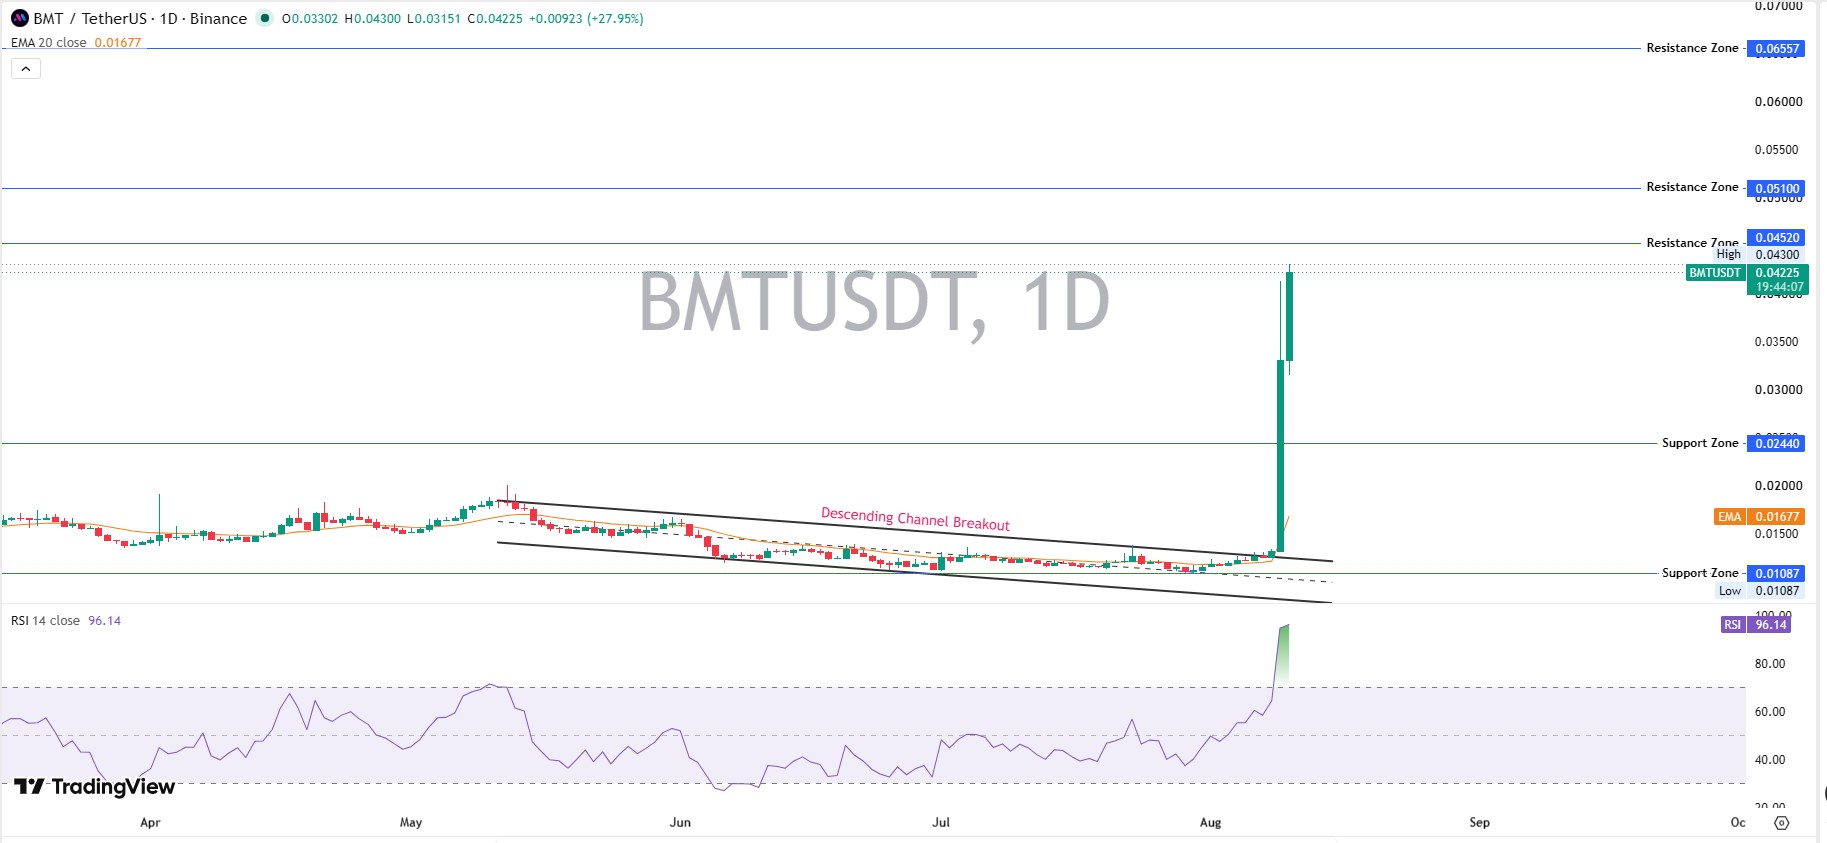
That doesn't mean an immediate crash, but it does mean chasing this candle carries real risk. Immediate resistance sits at 0.0452, then 0.0510, then a deeper ceiling at 0.0656. First support lands at 0.0244, with a much thinner floor near 0.0109 if momentum fails completely. EMA20 sits at just 0.0168, well under spot, showing how far this candle stretched above its own trend average. Momentum traders should watch for a cooldown candle before assuming continuation, not after, since an RSI this extreme usually cools before it climbs further.
Long-Term Chart Analysis (Weekly)
Zoom out to the weekly chart and the picture softens slightly. This longer Bubblemaps monthly price prediction view leans on RSI reading 72.57, still hot but nowhere near daily extremes, and EMA20 sits at 0.0192, also well below spot price.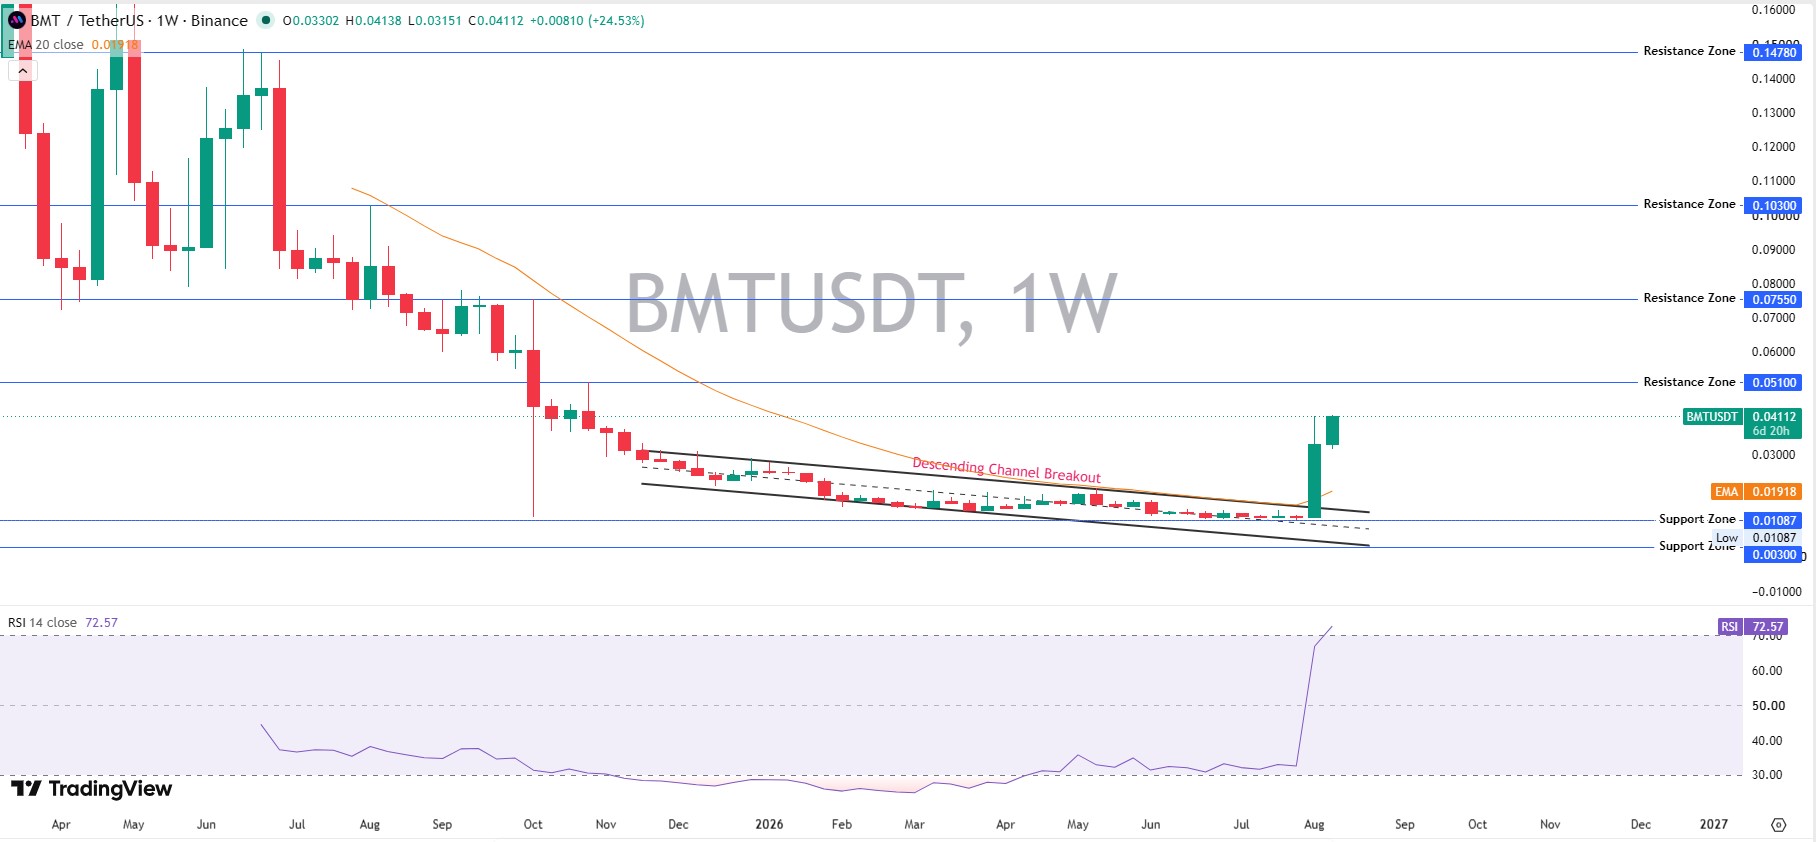
BMT had been sliding inside a falling channel since last year, and this week's candle reclaimed that structure on volume the token has not seen before. Weekly resistance zones stack up at 0.0755, then 0.1030, then a much higher ceiling near 0.1478. Support rests at 0.0109, with a deeper floor near 0.0030 tied to the token's broader downtrend low.
A weekly close above 0.0510 would strengthen the long-term Bubblemaps price prediction case meaningfully. Failure to hold above 0.0244 on a weekly basis would undo most of this week's structural gain and point back toward the prior range.
Tokenomics and Whale Holder Data
Solscan shows 5,868 holders on the Solana side as of this snapshot, per holder data. Top 10 wallets control 76.3% of tracked supply, worth roughly $15.35M, and whale wallets alone hold 63.17%. Just one wallet, the BMT vesting contract operator, holds 27.54% of the supply, worth over $5.5M.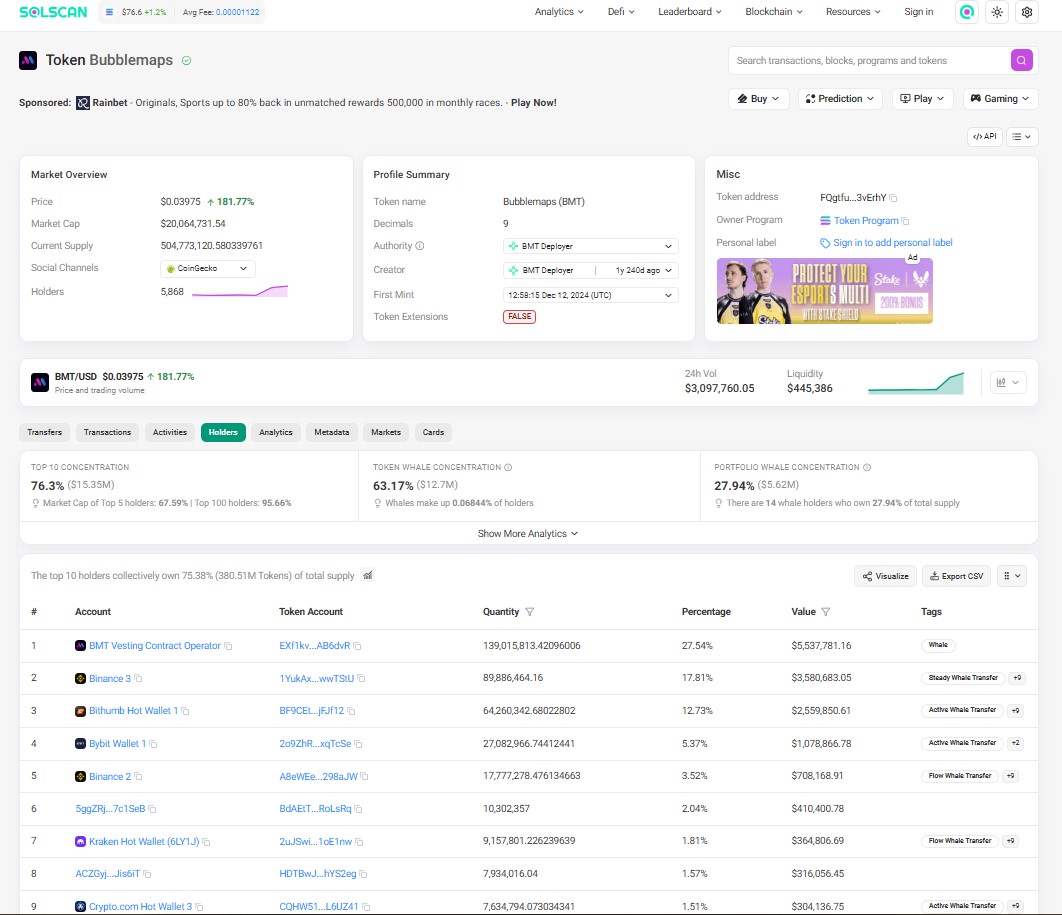
Exchange-labeled wallets add more concentration on top of that, including Binance's hot wallets holding a combined 21.33% and Bithumb at 12.73%. Total supply is fixed at one billion tokens, with circulating supply near 715.85M, per official tokenomics.
Liquidity sits at just 4.03% of market cap, a ratio worth watching rather than ignoring, and it is the kind of detail that belongs next to any ethereum price prediction 2026 comparison when judging how thin a small-cap order book really is. This kind of concentration is exactly why any Bubblemaps price prediction needs to weigh whale wallets as heavily as the chart itself.
Altcoin Momentum: Why BMT Trades Like an Analytics Narrative Coin
Bubblemaps positions itself as an on-chain analytics and wallet-mapping project rather than a simple utility token, which puts it closer to the on-chain data narrative than a fundamentals-first play. When a catalyst lands, like a short squeeze meeting a channel breakout, volume tends to chase the story before fundamentals catch up.
Rotations like this usually run hot, then cool. BMT's move off its recent low near $0.0109, hit just 11 days ago, fits that pattern, and whether the next leg holds probably depends more on sustained volume than on any single indicator. Traders can watch the coin events calendar for upcoming listing or unlock dates that tend to trigger these breakouts.
Bubblemaps (BMT) Price Prediction: Bull, Base, and Bear Scenarios
Scenario | Timeframe | Price Level | Probability | Invalidation |
Bull | 30D | $0.0656 | 25% | Loses $0.0300 support |
Base | 7D | $0.0300 to $0.0450 | 45% | Holds current range |
Bear | 24H | $0.0244 | 30% | Breaks below $0.0300 with volume |
In the longer term, the BMT price forecast 2026 outlook stays tied to whether this week's channel breakout can flip $0.0510 into support rather than resistance. On the bullish side, that same BMT price target 2026 case tops out near $0.0656 if squeeze-driven momentum carries into the next few weeks.
Our base-case Bubblemaps price prediction leans toward consolidation rather than an immediate breakout beyond $0.0510. The short-term RSI is too hot to chase right now. And the weekly structure still has room, so dips toward 0.030 to 0.024 look more like opportunity than danger as long as squeeze-driven volume stays warm. Anyone tracking similar setups can watch crypto airdrops and upcoming unlock schedules that tend to trigger these breakouts. Cautiously bullish over the next week, not neutral, and not blindly bullish either.
Key Risks and What Would Invalidate This Setup
Daily RSI near 96 means a short-term cooldown is likely before any fresh leg up.
Squeeze-driven candles can lose momentum fast once short-covering flow dries up.
A handful of whale wallets, holding over 76% combined, can move price sharply on their own.
No sustained spot demand has been confirmed beyond the breakout day, and that flow could unwind.
A close back below $0.0244 would break the current structure and open the path toward $0.0109.
For token-launch context and unlock schedules across the sector, the crypto exchange listing tracker is worth a scan before sizing any position.
Disclaimer
This article is for informational purposes only and is not financial advice. Crypto assets, especially low-cap altcoins, carry high volatility and risk of total loss.

















