Canton Coin Price Prediction: Can CC Rebound From $0.088?


Canton Coin has had a rough month. The Canton Coin Price Prediction question on most traders' minds right now is simple: does the drop stop near $0.08870, or does it keep going?
CC is trading around $0.094 after a steep slide that has pulled price into oversold territory on the daily chart, right at a support zone that could decide where this goes next.
Why Is Canton Coin Price Falling?
The numbers tell a clear story of sustained selling. CC is down 5.21% over the past 24 hours, 17.98% over the past week, and 30.22% over the past 30 days.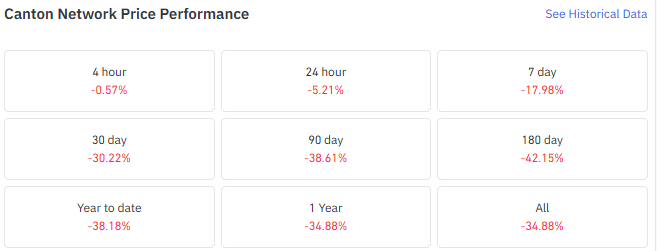
This isn't a single bad day; it's a multi-week grind lower, and the pace hasn't meaningfully slowed even as the price nears a key technical zone.
What Are CC Derivatives Traders Signaling?
Derivatives data doesn't give a clean answer here, and that's worth noting on its own.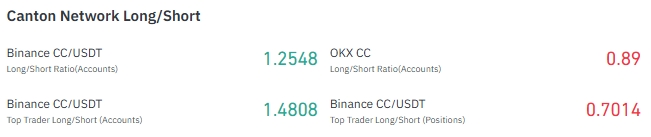
Binance's overall CC/USDT account ratio leans long at 1.2548, and top trader accounts lean long too at 1.4808.
But top trader positions on Binance sit at 0.7014, below 1, meaning that group is actually leaning short once position size is factored in. OKX accounts sit at 0.89, also below 1.
That's a divergence, not a signal. Accounts and top-trader positioning are pulling in different directions, so calling this bullish or bearish would be reading more into it than the data supports.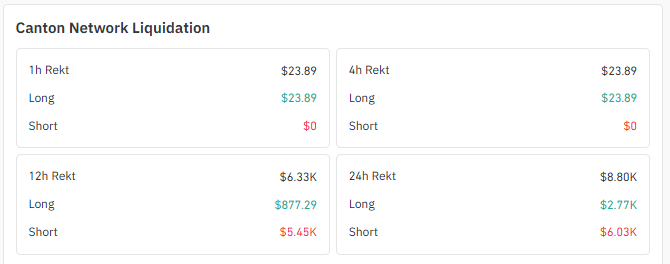
Liquidations add a small wrinkle. Over 24 hours, shorts took the bigger hit at roughly $6.03K against $2.77K in longs, and the 12-hour window shows the same lean, $5.45K in shorts versus $877 in longs.
Short liquidations outpacing longs during a decline can happen when late shorts get squeezed on a bounce attempt, but it's a minor data point, not proof of a reversal. Open interest sits near $29.60M and has stayed meaningful through the drawdown, which just shows traders are still active in the market, not which way they expect it to break.
Data source: coinglass
Canton Coin Price Prediction: Can $0.08870 Support Hold?
This is the level that matters most right now. CC has been trading inside a descending channel on the TradingView daily chart for weeks, with a pattern of lower highs and lower lows that has kept the broader structure bearish.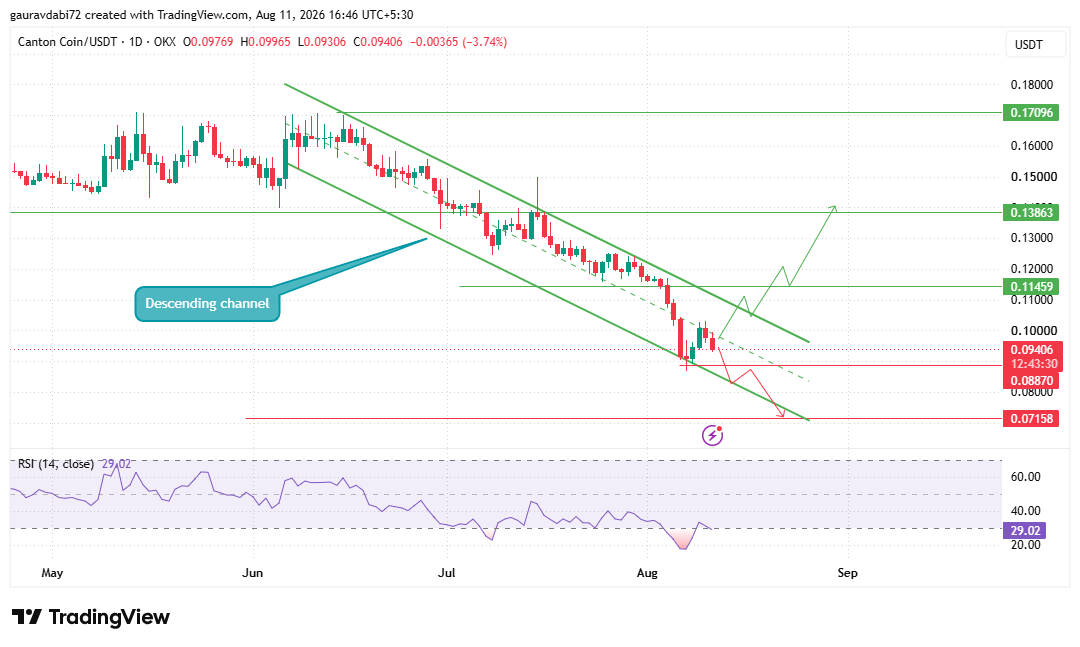
Price recently touched the lower edge of that channel near $0.08870 and tried to bounce, though buyers haven't yet turned that into a confirmed reversal.
Daily RSI sits at 29.02, solidly in oversold territory.
If CC holds above $0.08870 and buying pressure builds, a move toward $0.11459 becomes realistic.
A stronger push could open the door to $0.13863, and $0.17096 sits further out as a level that would need a real shift in market structure to reach, not just a short-term bounce.
The other side of this: a confirmed daily close below $0.08870 would break the current support and put $0.07158 in view as the next major downside level. Nothing about the current setup makes CC bullish.
It stays bearish unless the price actually breaks and holds above the descending channel.
Data source: TradingView
Is CC Oversold Enough for a Price Rebound?
An RSI reading of 29.02 raises the odds of a relief bounce. “Oversold conditions can sometimes precede short-term relief bounces during downtrends.”
But oversold is not the same as "bottomed." Plenty of assets stay oversold for extended stretches while the price keeps drifting lower.
The RSI reading is a reason to watch closely, not a reason to assume the worst is over.
Overall Technical Sentiment
Bearish with oversold rebound potential.
Scenario | Technical Outlook |
Bullish | $0.08870 holds, and CC begins recovering toward $0.11459, with stronger confirmation potentially bringing $0.13863 into focus. |
Base | CC stays inside the descending channel and consolidates around current support without a clear breakout in either direction. |
Bearish | A confirmed breakdown below $0.08870 exposes $0.07158 as the next downside target. |
None of these outcomes should be treated as guaranteed.
What We're Watching Next
As per the Coin Gabbar analyst, the $0.08870 zone is the level to track first. A daily close that holds above it, paired with RSI starting to climb out of oversold, would be an early sign buyers are stepping back in, with $0.11459 as the first real test above that.
A break and close below $0.08870 would shift the focus toward $0.07158 instead. Until one of those happens, the descending channel remains intact and the broader trend stays bearish.
Disclaimer: This article is for informational purposes only and does not constitute financial or investment advice. Cryptocurrency markets are volatile and speculative. Readers should conduct their own research before making any trading or investment decisions.

















