Cardano Price Prediction: ADA RSI Signal Sparks 14X Talk To $2.90


A wild claim is doing the rounds in crypto circles right now, and it has traders watching Cardano like never before.
Cardano price prediction chatter has picked up sharply after a widely shared post pointed to an eight-year RSI pattern on ADA, the kind of signal that historically shows up only once in a very long while.
Whenever a setup like this starts trending, the chart underneath it usually has something worth paying attention to, and this time is no different.
Before jumping to conclusions, it helps to look at what the ADA chart is actually showing right now, what the latest Cardano news is saying, and where the real trigger levels sit. Here is the full breakdown.
Cardano Price Today: Live ADA Data and 24-Hour Change
ADA is trading around $0.2179 at the time of writing, based on the 1D chart on Binance.
Cardano futures volume over the past 24 hours stands at $751.79 million, while spot volume adds another $143.17 million, showing that both derivatives traders and spot buyers are actively engaged with the ADA price prediction narrative today.
The Cardano market cap is holding near $8.01 billion, with open interest at $465.13 million, reflecting how many leveraged positions are currently riding on this move.
Circulating supply sits at 36.73 billion ADA out of a total supply of 44.99 billion, with the max supply capped at 45.00 billion, meaning most of Cardano's eventual token supply is already in circulation.
Source: CoinGlass, Cardano data, Sep 8, 2026
Cardano News: ADA RSI Signal Sparks Bold Price Target Talk
The biggest talking point in Cardano's latest news this week is a post from Cardano Feed on X, published September 8, 2026, highlighting what it calls an eight-year RSI signal on ADA, with a video framing a potential run toward $2.90 and describing it as a possible 14X move from current levels.
The post has already crossed a few thousand views and picked up dozens of likes within hours, showing how much appetite there is for a bullish Cardano trend analysis right now. It is worth being clear-eyed here.
A long-horizon RSI pattern can be a genuinely interesting technical observation, but a specific dollar target and multiplier framed this aggressively is community excitement more than a confirmed outcome.
Cardano price prediction updates like this are best treated as one data point among many, not a promise of where ADA is headed next.
Source: Cardano Feed (@CardanoFeed) on X, Sep 8, 2026, 4:12 PM
ADA Quick Take: Key Trigger and Support Levels Today
CMP: $0.2179 (1D chart, Binance)
Weekly resistance trigger: break and close above $0.2587 needed to open the next leg up
Weekly support trigger: break and close below $0.1895 needed to shift the bias lower
Data timestamp: Sep 8 to Sep 9, 2026
Risk note: leveraged positioning is elevated given the $465.13 million open interest, so moves in either direction can be sharper than usual
Cardano Technical Analysis: ADA Price Forecast and Trend Outlook
Looking at the daily ADA chart on Binance, the structure tells a cleaner story than the headlines suggest.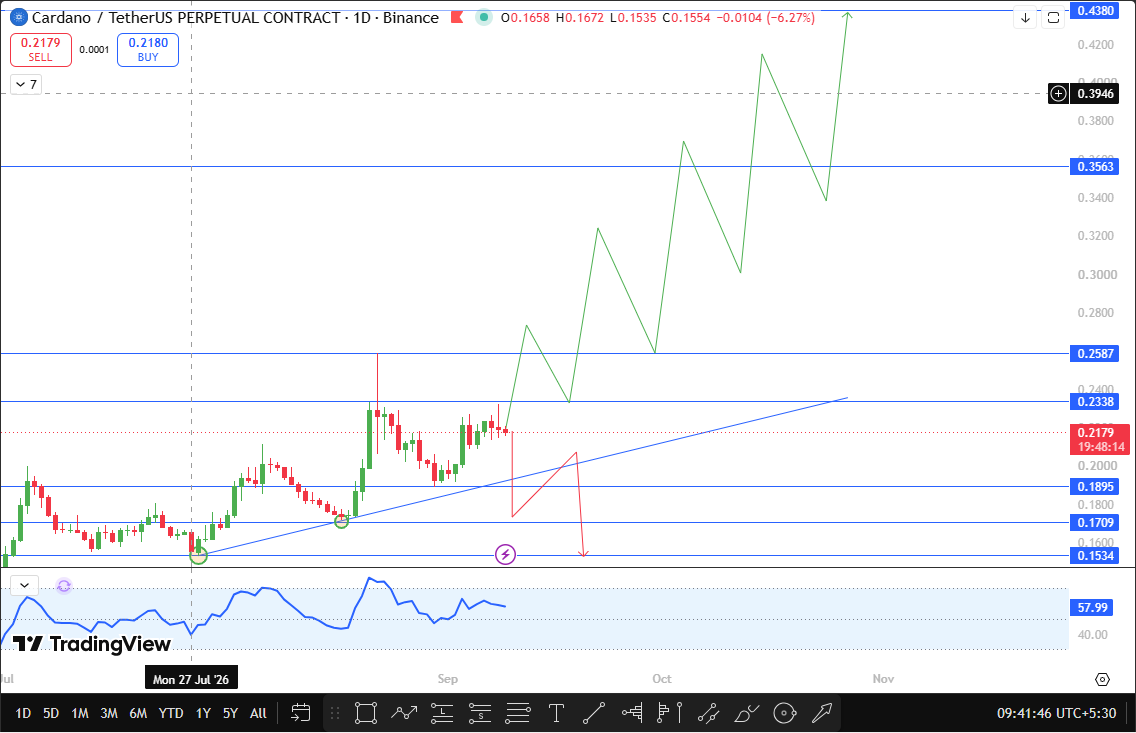
Price built an ascending trendline from the lows, took its first retest off that trendline, and then delivered a genuinely aggressive upmove rather than a slow grind.
That kind of sharp impulsive rally after a clean trendline retest usually signals strong buying interest stepping in at the right moment, and it is a big part of why this Cardano price outlook is leaning constructive in the near term.
Right now, ADA is sustaining just under a key resistance zone rather than falling straight back down, which itself is a meaningful sign.
A rejection here would normally come with a fast, sharp drop, and that has not happened yet.
Instead, price is holding its ground near resistance, and that kind of consolidation right below a ceiling often precedes an attempt to push through it.
If ADA manages a daily close above $0.2587, that would confirm the breakout and open the door toward $0.3563 next, a level that sits roughly 63.5% above the current price.
Should momentum extend beyond that, the next major target on this ADA price forecast comes in at $0.4380, around 101% above CMP.
These are not small moves, and getting there would require sustained buying pressure over multiple sessions, not just a single green candle.
On the flip side, if $ADA fails to hold its footing and closes below $0.1895 on the daily chart, that would signal the current strength is fading.
In that scenario, the next support to watch sits at $0.1709, roughly 21.6% below CMP, followed by $0.1534 further down, around 29.6% below current levels.
A close below $0.1895 alone would already represent close to a 9% pullback from where ADA sits today, so this is not a distant or unrealistic support test.
For now, the technical analysis leans in favor of the bulls as long as ADA keeps sustaining near resistance rather than getting rejected outright, but the $0.2587 level remains the real line in the sand for this Cardano price forecast to play out as expected.
Source: TradingView, ADA/USDT Perpetual, Binance, 1D chart, Sep 8, 2026
ADA Support and Resistance Levels to Watch
Level Type | Price | Change from CMP ($0.2179) |
Major Resistance 2 | $0.4380 | +101.0% |
Major Resistance 1 | $0.3563 | +63.5% |
Breakout Trigger | $0.2587 | +18.7% |
Current Market Price | $0.2179 | — |
Breakdown Trigger | $0.1895 | -8.9% |
Support 1 | $0.1709 | -21.6% |
Support 2 | $0.1534 | -29.6% |
ADA Price Prediction Scenarios: Bull, Base, and Bear Cases
In the bull case, $ADA holds its current footing near resistance, buyers keep stepping in on any dip, and the price eventually closes above $0.2587.
That would confirm the breakout structure and put $0.3563 in play, with $0.4380 as the stretch target if the rally keeps its current intensity.
This scenario would also give some technical backing, though not confirmation, to the kind of bold Cardano price prediction floating around social media this week.
The base case is less dramatic but arguably more likely in the short run.
$ADA continues to chop just below $0.2587, testing the resistance a few times without a clean close above it, while also avoiding a breakdown below $0.1895.
This kind of sideways grind near a key level is common before a real directional move, and it would mean patience is the better strategy over chasing either extreme.
The bear case plays out if buyers lose interest and $ADA slips below $0.1895 on a daily close.
That would undo much of the recent bullish structure and shift attention toward $0.1709 first, with $0.1534 as the deeper support if selling pressure builds.
Traders leaning bullish on ADA right now would want to see this level hold firm rather than break.
Risks to This Cardano Price Outlook
Crypto markets can move fast in both directions, and Cardano is no exception.
The RSI signal being discussed online adds fuel to sentiment, but sentiment-driven rallies can reverse just as quickly as they build, especially with open interest as high as $465.13 million sitting on the books right now.
Broader market conditions, Bitcoin's own price action, and any sudden shift in risk appetite across crypto can all override a coin-specific technical setup like the one described here.
This article is for informational purposes only and should not be treated as financial advice.
Key Terms for Cardano Price Prediction
Ascending Trendline: A rising line connecting a series of higher lows, used to identify where buyers are stepping in during an uptrend.
Breakout: When price moves decisively above a resistance level on strong volume, it often signals the start of a new upward trend.
Support and Resistance: Price zones where buying or selling pressure has historically been strong enough to pause or reverse a move.
Open Interest: The total number of outstanding derivative contracts, used to gauge how much leveraged money is active in a market.
RSI (Relative Strength Index): A momentum indicator used to measure whether an asset is potentially overbought or oversold based on recent price action.
Disclaimer
This article is intended for informational and educational purposes only. It does not constitute financial, investment, or trading advice. Cryptocurrency markets are highly volatile, and readers should conduct their own research or consult a qualified financial advisor before making any investment decisions.

















