Pi Network Price Prediction: Will Protocol 27 Change PI's Trend?

This Pi Network Price Prediction looks at where PI stands just days ahead of one of its most anticipated network upgrades yet.
Pi Network launched in 2019 as a mobile mining project before transitioning to Open Network, where PI now trades as a fully transferable token.
The PI Network price today is $0.09786 right now, up 3.6% over the last 24 hours, moving inside a $0.09446 to $0.09958 range, with a market cap of $1.09B.
Pi Network Live Market Data
| Metric | Value |
| Price | $0.09786 |
| Market Cap | $1.09B |
| Fully Diluted Valuation | $1.677B |
| 24-Hour Trading Vol | $7.711M |
| Circulating Supply | 11.142B |
| Total Supply | 17.141B |
| Max Supply | 100B |
Source: Pi Network market data taken from CoinGecko, as of Sep 09, 2026. Figures may vary slightly across other tracking websites.
Pi Network News Today: Protocol 27 Countdown
Community Weighs What Protocol 27 Means Next
Separately, Pi Network News Alerts described Protocol 27 as the final planned upgrade, bringing improved smart contract authentication alongside DEX and AMM infrastructure, deeper liquidity, and real on-chain utility. 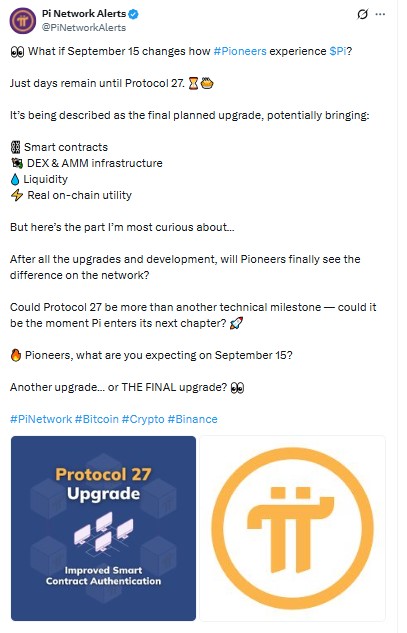
Source: Data Taken From @PiNetworkAlerts , X Account, as of Sep 9, 2026
The post raised an open question for the community: whether this upgrade finally translates into a visible difference on the network or simply adds to a string of prior updates.
That uncertainty is worth keeping in mind alongside the price levels below, since the market's reaction will likely depend on what actually ships on September 15 rather than the announcement itself.
A Breakout Setup Ahead Of The Upgrade
CoinGape reported that PI is holding above $0.095 as Protocol 27, expected to launch September 15, brings smart contracts along with DEX, AMM, and liquidity features to the network.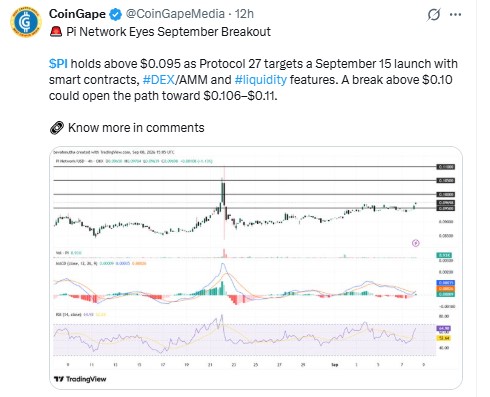
Source: Data Taken From @CoinGapeMedia , X Account, as of Sep 9, 2026
The outlet noted that a break above $0.10 could open the path toward the $0.106 to $0.11 zone, tying the chart setup directly to the upgrade timeline.
Pi Network Price Prediction 2026: Technical Outlook
On the daily PI/USDT chart on OKX, price has been consolidating inside a symmetrical triangle since July, with a descending upper boundary meeting a rising lower boundary.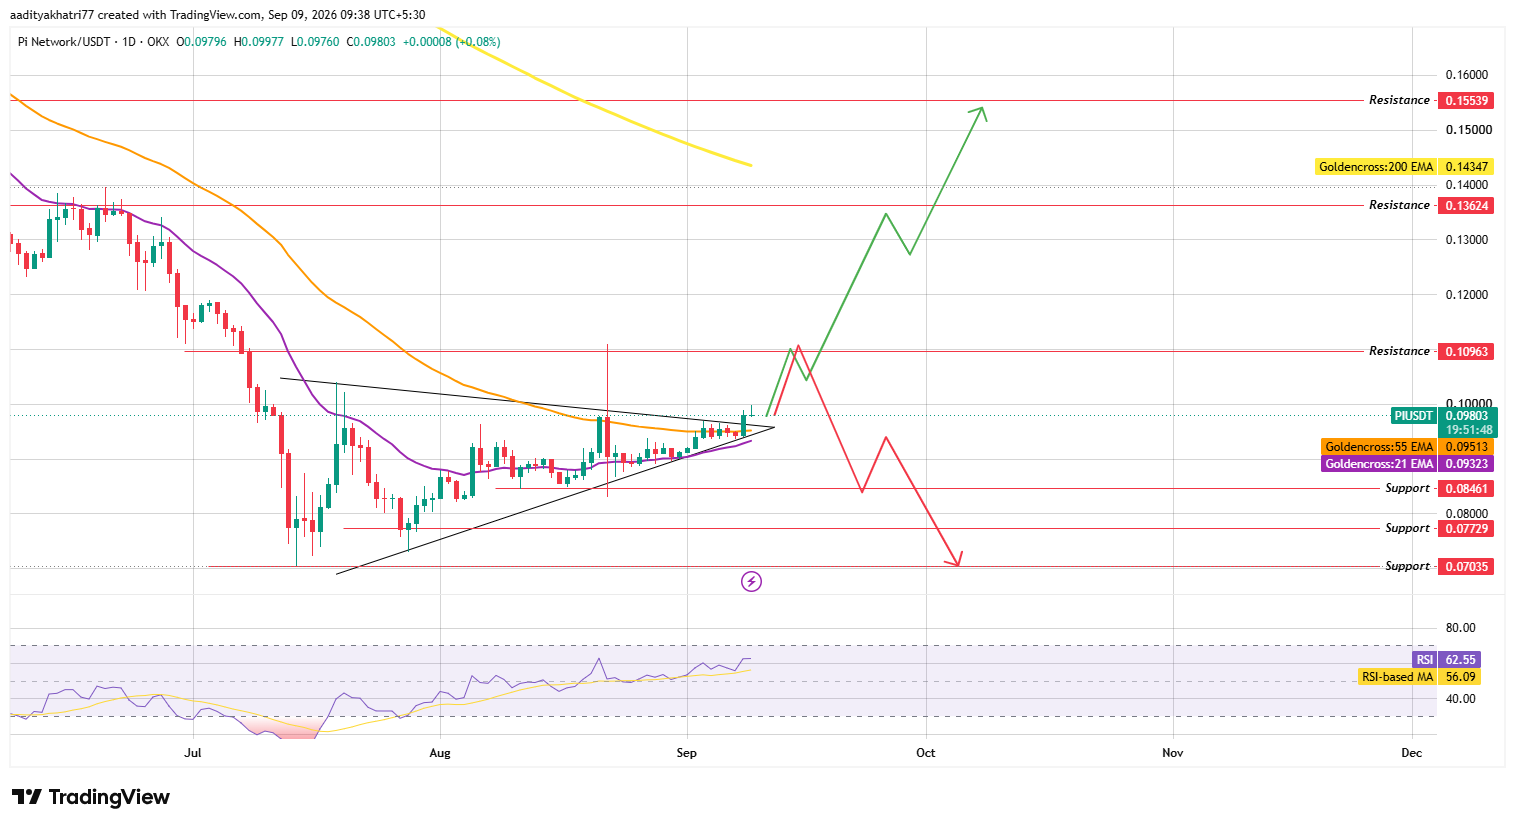
Source: Chart Taken From TradingView , as of Sep 9, 2026
$PI is now pressing against that upper boundary, and price is currently trading above both its 21-day and 55-day EMAs, a sign that short-term momentum has turned supportive.
RSI stands at 62.55, above its moving average of 56.09, reflecting building bullish momentum without being extended.
Could PI Break Toward Higher Resistance?
If PI closes a daily candle above the triangle's upper boundary with rising volume, the first target becomes $0.10963.
Clearing that on continued strength opens the path to $0.13624, with $0.15539 as the next resistance if momentum carries further into the month.
What Happens If PI Gets Rejected From Resistance?
If instead the price gets turned away at the triangle's resistance and slides back down, the first support to watch is $0.08461.
A failure to hold that level could send PI toward $0.07729, and continued weakness would put $0.07035 in view.
Support and Resistance Levels
| Support | Resistance |
| $0.08461 | $0.10963 |
| $0.07729 | $0.13624 |
| $0.07035 | $0.15539 |
EMA Levels (Daily)
| EMA | Level |
| 21 EMA | $0.09323 |
| 55 EMA | $0.09513 |
| 200 EMA | $0.14347 |
Bull, Base, and Bear Scenarios
| Scenario | Setup | Level |
| Bull | Daily close above triangle resistance on volume | $0.10963–$0.15539 |
| Base | Price consolidates near triangle resistance. | $0.093–$0.100 |
| Bear | Rejection from resistance, break of triangle support | $0.08461–$0.07035 |
Glossary
A symmetrical triangle forms when a falling resistance line and a rising support line squeeze price into a narrowing range, and the eventual breakout, in either direction, often carries real weight precisely because of that compression.
An EMA, short for exponential moving average, weights recent price action more heavily than older data, making it quicker to react than a plain moving average.
RSI tracks the speed and size of recent price moves, which is how traders judge whether momentum is building or starting to fade.
Support and resistance are simply the zones where buying or selling pressure has repeatedly shown up in the past, strong enough to pause or reverse a move.
PI vs Bitcoin
PI Coin price action still largely mirrors the broader crypto market's mood rather than moving on an independent script, and that connection to Bitcoin remains a key backdrop for any Pi Network news that touches price.
When Bitcoin trades with more conviction, PI's breakout or rejection scenarios above tend to play out with more force in either direction, reflecting how closely a token at PI's liquidity level still leans on overall market risk appetite.
Methodology
This Pi Network price prediction 2026 Outlook is based on daily candlestick data from OKX, EMA and RSI readings, and the symmetrical triangle structure that has formed since July 2026.
The scenario levels above are tied to specific breakout or rejection conditions and are not guaranteed outcomes, particularly with Protocol 27 introducing a real event-driven variable into the picture this month.
Expert Opinion
Market commentators tracking PI's setup note that a symmetrical triangle resolving right around a major upgrade date is a fairly common pattern, since anticipation itself tends to build volume into the breakout window.
Their view is that Protocol 27's actual delivery, smart contracts, DEX and AMM infrastructure, and improved liquidity will likely matter more for sustaining any move than the announcement alone, since markets have a tendency to price in expected news ahead of the event itself.
Disclaimer: This Pi Network price prediction is for informational purposes only and should not be treated as financial advice. Cryptocurrency markets are highly volatile, technical patterns can fail to play out as expected, and any of the scenarios described above carry a realistic probability of not occurring. Readers should conduct independent research before making any investment decisions.

















