Celestia TIA Price Prediction: Is the 30% Rally Just the Beginning?


Celestia has been building fresh momentum after months of heavy selling pressure, and this Celestia TIA price prediction looks at whether the recent bounce can turn into something bigger.
The token has broken out of a pattern that had capped it for weeks, and traders are now watching how it behaves around the levels that mattered on the way down.
What the Derivatives Market Is Signaling for Celestia
Celestia TIA is trading at $0.43, up 14.88% in the past 24 hours.Market capitalization stands near $414.77 million, with a fully diluted valuation of about $505.5 million, per DefiLlama data.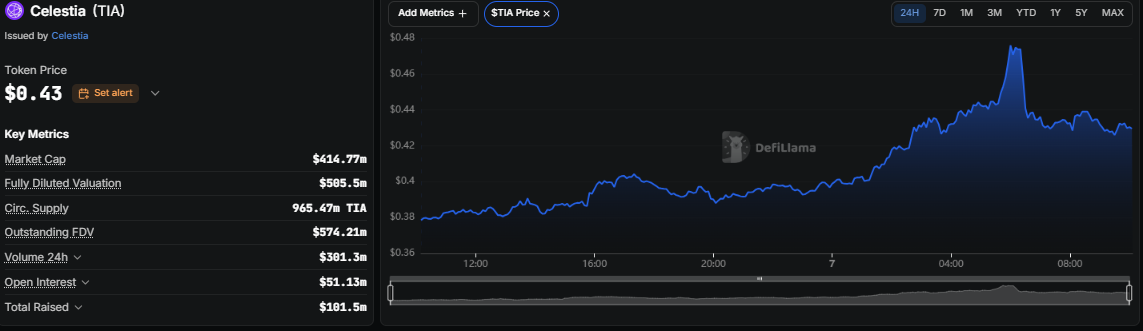
Circulating supply is listed at 965.47 million TIA, and the project has raised a total of $101.5 million to date.
24-hour trading volume across the market is close to $301.3 million, with Binance leading futures turnover at $104.17 million.
TIA Price Performance and Long-Short Positioning
Altcoin market sentiment has clearly turned in Celestia's favor over the past month.
TIA is up 34.04% over 7 days, 33.47% over 30 days, and 37.51% over 90 days, though the token remains down sharply on a longer horizon, still off 72.86% over the past year and 79.27% since its all-time high.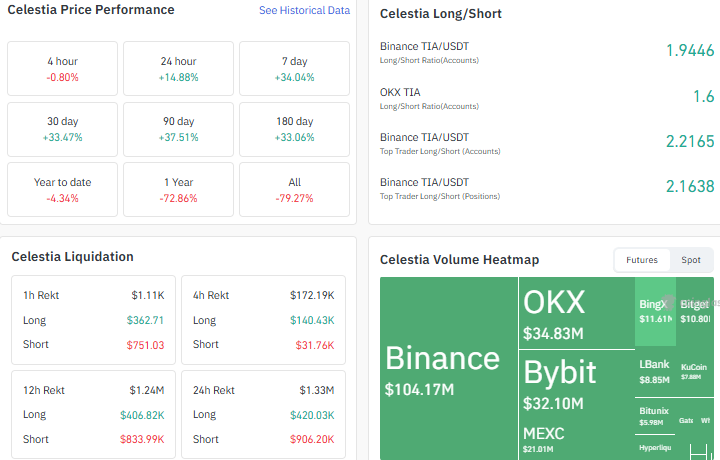
Near-term momentum has cooled a touch, with the 4-hour change reading -0.80%. Long-short positioning stays tilted toward longs, with Binance TIA/USDT accounts at a 1.9446 ratio, OKX at 1.6, and Binance's top-trader accounts even higher at 2.2165 as per Coinglass data.
Liquidation data over the past 24 hours shows $906.20K wiped from short positions against $420.03K from longs, a pattern that lines up with a short squeeze feeding this move rather than pure fresh long demand alone.
TIA Open Interest Analysis
Open interest in Celestia futures has jumped to $63.25 million, per Coinglass data, up sharply from lows closer to $20 million in mid-August.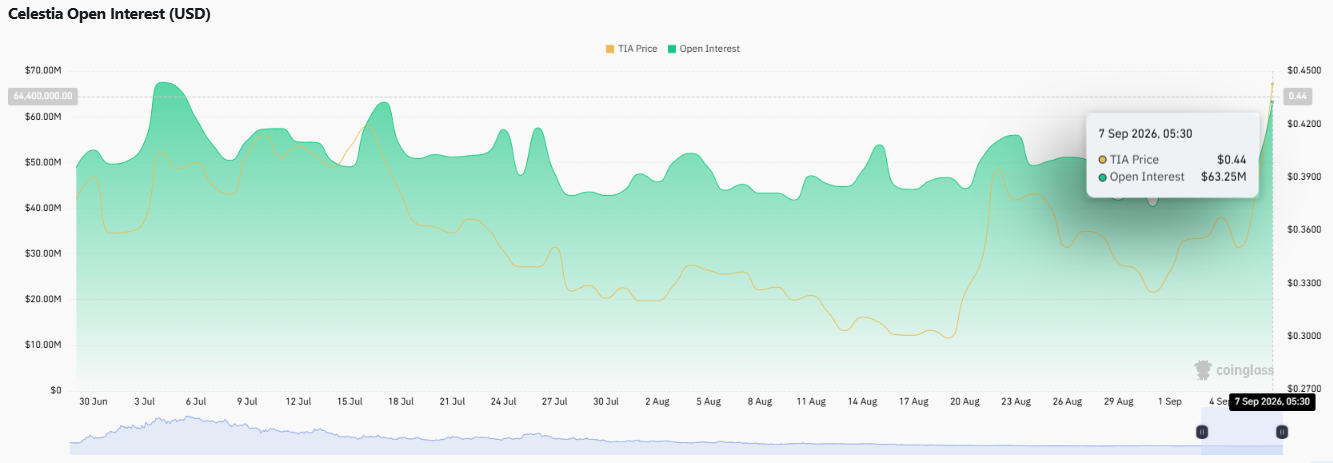
The Coinglass open interest chart shows this build tracking closely with the recent price recovery, which usually points to fresh capital entering long positions rather than simple short covering.
That said, open interest had climbed to a similarly elevated $64.4 million back in early July before price rolled over again, so this rise alone isn't proof the rally holds; it needs to be read alongside how price actually behaves at resistance.
TIA On-Chain Activity on Osmosis
On-chain data via Mintscan shows roughly 2,645,128 TIA, worth close to $1.14 million, held in the IBC-denominated form tracked on Osmosis.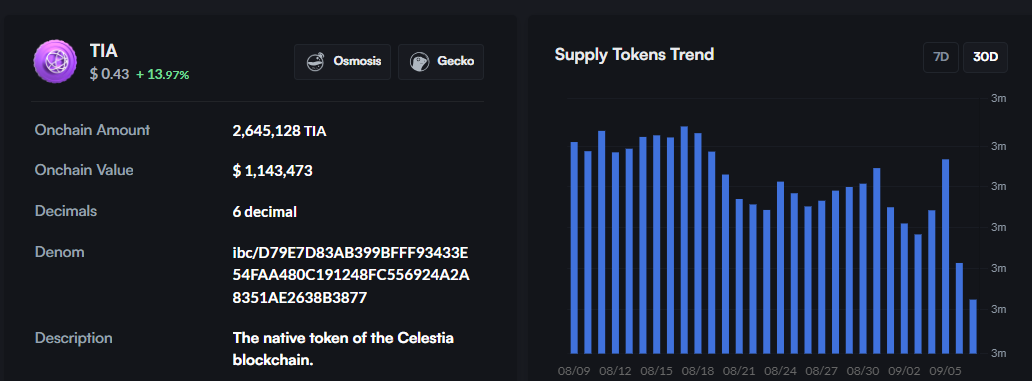
The 30-day trend for this on-chain activity shows supply pulling back from levels above 3 million TIA in mid-August before ticking higher again in early September, a pattern that loosely tracks the broader price recovery.
Is TIA's Triangle Breakout Holding on the Weekly Chart?
TIA's TradingView weekly chart has been messy for a long time, and it's easy to see why.
After collapsing from well above $1 last year, price spent months carving out a descending triangle, the kind of pattern where every rally gets capped a little lower while the floor around 0.4217 kept catching the sell-offs.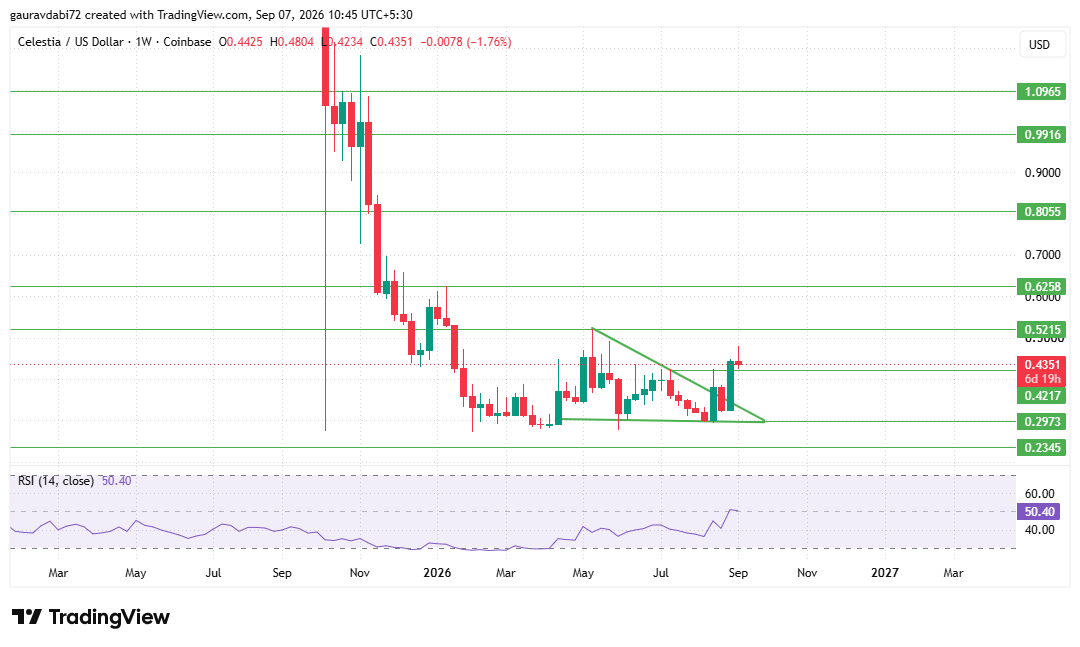
That floor is exactly what gave way this time. Last week's candle was a big, decisive green bar that pushed straight through the top of the triangle, and even though the current week has pulled back slightly to $0.4351 after tagging a high of $0.4804, the pullback hasn't undone the breakout.
RSI sits right around 50, so momentum isn't stretched in either direction; it's basically neutral with room to move whichever way buyers or sellers push it next.
What matters most from here is whether 0.4217 keeps acting as support instead of turning back into a lid, since that's the exact level the whole breakout is built on.
Celestia Price Prediction and Outlook
Where TIA heads next comes down largely to whether 0.4217 keeps holding as support.
If it does and buyers stay engaged, a move toward 0.5215 looks like the first real test, and a sustained close above that could eventually bring 0.6258, 0.8055, and even 0.9916 into view further out.
None of that happens automatically, though. Price could just as easily spend time working sideways above 0.4217 while the market decides whether last week's breakout deserves to be trusted at these levels.
A slip back below 0.4217 would put 0.2973 and then 0.2345 back in focus on the downside.
Key Risks and Levels to Watch
The clearest risk here is that the move loses steam once the short squeeze behind it runs its course, since squeezes tend to fade fast after the forced buying dries up.
The 0.4217 level is the one to watch most closely; holding above it keeps the breakout story alive, while a close back beneath it would undo much of the recent structural improvement.
On the way up, 0.5215, 0.6258, 0.8055, 0.9916, and 1.0965 line up as resistance zones further out, while 0.2973 and 0.2345 sit below as the next supports if the setup weakens.
Expert Opinion
As per the CoinGabbar analyst desk, the combination of a confirmed triangle breakout, rising open interest, and a short-squeeze-driven liquidation pattern gives this part of the blockchain ecosystem a constructive setup for now, though the modest pullback on the current weekly candle is a reminder that the breakout still needs to prove itself around 0.4217 before the bigger resistance levels come into play.
Conclusion
Celestia's break out of its multi-month triangle, backed by a sharp rise in open interest and heavily long-skewed derivatives positioning, keeps the near-term structure tilted bullish.
Whether TIA can work its way toward 0.5215 and beyond, or simply consolidate above its breakout level, will likely depend on how price behaves around 0.4217 in the coming sessions.
Disclaimer: This article is for informational purposes only and does not constitute financial or investment advice. Cryptocurrency markets are highly volatile, and readers should conduct their own research before making any investment decisions.
Also read:

















