Dogecoin Price Prediction: X Crypto Push Fuels DOGE Bounce Hopes


Dogecoin price prediction has a genuinely interesting setup behind it right now, because a chart-level retest is lining up with a piece of dogecoin news that could matter well beyond the daily candle.
Dogecoin has spent over a decade as the coin that made meme culture and crypto collide, and it still carries one of the largest, most active communities in the space.
The Dogecoin price today sits at $0.09032, down 1.7% over the past 24 hours, as the price pulls back to retest the resistance zone it broke above just a few days earlier on the daily chart.
Dogecoin Live Market Data
Metric | Value |
Price | $0.09032 |
24h Change | -1.7% |
24h Range | $0.08818 - $0.09193 |
Market Cap | $14.071B |
Fully Diluted Valuation | $14.071B |
24h Trading Volume | $852.565M |
Circulating Supply | 155.813B |
Total Supply | 171.525B |
Max Supply | Unlimited |
Source: DOGE market data as of Sep 07, 2026. Figures may vary slightly across other tracking websites.
Exchange Volume
Binance is carrying the bulk of DOGE volume at $721.26M, well ahead of OKX at $373.69M and Bybit at $143.29M.
Gate ($85.26M), Bitget ($80.22M), WhiteBIT ($77.32M), and MEXC ($76.85M) form the next tier, with Bitunix, BingX, and Aster contributing smaller but still notable amounts.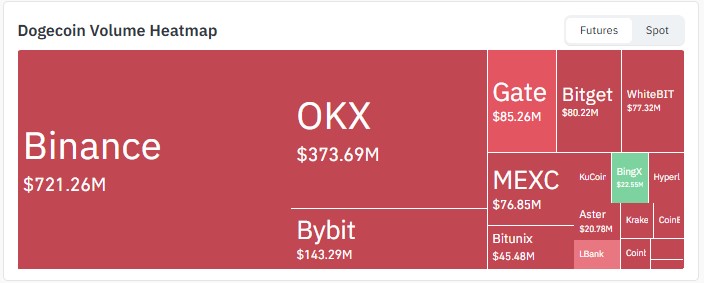
Source: Volume heatmap data taken from CoinGlass, as of Sep 07, 2026.
Liquidation Data
Timeframe | Total Liquidated | Longs | Shorts |
1h | $17.43K | $327.02 | $17.10K |
4h | $442.29K | $334.72K | $107.57K |
12h | $1.10M | $545.61K | $554.29K |
24h | $3.32M | $2.69M | $631.20K |
Source: Liquidation data taken from CoinGlass, as of Sep 07, 2026.
Longs have taken by far the bigger hit over the past day, losing $2.69M against just $631.20K on shorts, which lines up with a pullback catching leveraged buyers off guard after the recent breakout.
The shorter windows tell a more balanced story, with the 12h split nearly even between longs and shorts, suggesting the heaviest damage was concentrated earlier in the 24-hour window rather than happening continuously.
Dogecoin News Today
The biggest piece of dogecoin news right now didn't come from the chart at all.
A widely followed account confirmed that X has plans to launch crypto trading for its roughly 650 million users, tagging DOGE directly in the post.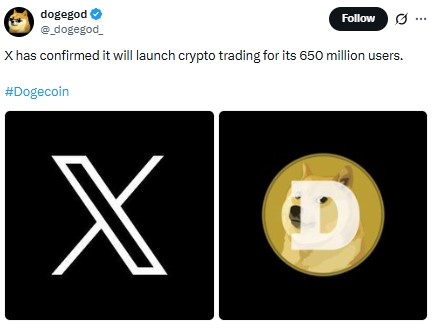
Source: Data Taken From @_dogegod_, X Account.
Nothing about rollout timing or which tokens would be included has been confirmed beyond that post, so this should be treated as an early signal rather than a done deal.
Even so, a platform with that kind of user base entering crypto trading is the sort of $DOGE news that tends to get priced in well before any official launch date.
Dogecoin Price Prediction Outlook: Technical Analysis
The daily DOGE/USDT chart on Binance tells a clear story. Price spent weeks inside a descending channel before breaking above its upper boundary on strong volume, and it's now pulling back to retest that same zone from above.
This kind of retest is common after a breakout. Whether the old resistance now holds as support decides a lot about where this dogecoin price prediction goes next.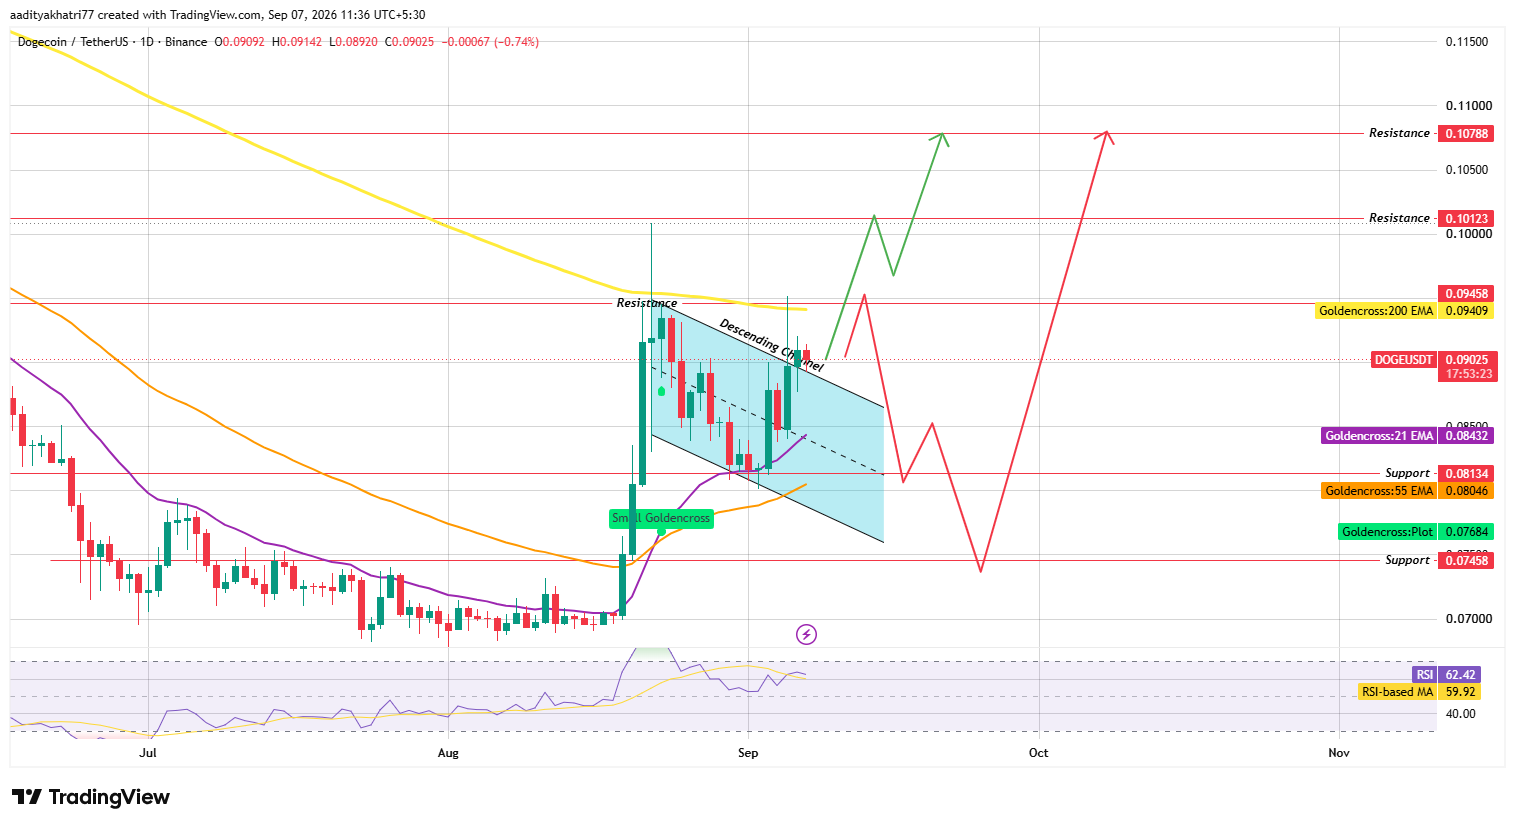
Source: Chart taken from TradingView, Binance DOGE/USDT pair, as of Sep 07, 2026, 11:36 UTC+5:30, daily timeframe.
Can DOGE Bounce Off the Retest Zone?
If buyers step back in here with volume behind them, holding the broken channel resistance as new support, the path opens toward $0.10123, with $0.10788 as the extended level if momentum carries through.
That kind of move would also be the clearest sign yet that this dogecoin price prediction 2026 setup has legs beyond just a short-term bounce.
What Happens If DOGE Loses This Zone?
A rejection here instead, followed by a confirmed daily close back below the retest zone, would risk a slide toward $0.08134, with $0.07458 as the next support if that level fails too.
RSI is at 62.42 against a moving average of 59.92, still leaning bullish but not stretched. That combination usually gives a retest like this room to resolve either way without an overbought signal forcing the outcome.
Support and Resistance Levels (Daily Chart)
Level Type | Price |
Resistance 3 | $0.10788 |
Resistance 2 | $0.10123 |
Resistance 1 | $0.09458 |
Support 1 | $0.08134 |
Support 2 | $0.07458 |
EMA Levels (Daily Chart)
EMA | Price |
21 EMA | $0.08432 |
55 EMA | $0.08046 |
200 EMA | $0.09409 |
Dogecoin Price Prediction: Bull, Base, and Bear Scenarios
Scenario | Setup | Level |
Bull Case | The retest zone holds as support; the price clears $0.09458 on volume. | $0.10123, then $0.10788 |
Base Case | Price chops around the retest zone without a clear break. | Range-bound between $0.08134 and $0.09458 |
Bear Case | Retest zone fails, confirmed daily close below support | $0.08134, with risk toward $0.07458 |
Glossary
A descending channel is two parallel trendlines sloping downward, and DOGE spent weeks trapped inside one before this breakout.
Once the price clears the upper boundary of a pattern like that, the old resistance line often flips into support, which is exactly the level getting tested now.
RSI is the same 0-to-100 momentum gauge that shows up in most of these breakdowns, and right now it's telling a fairly calm story, bullish, but not so stretched that a pullback would be surprising.
Liquidation is what happens when a trader's leveraged position gets force-closed because there isn't enough margin left to absorb the loss, and the long-heavy numbers here show plenty of buyers got caught leaning the wrong way during this pullback.
Dogecoin vs Bitcoin
$DOGE's retest lines up with its own chart pattern and the X trading news more than anything specific in Bitcoin price today action.
That said, $DOGE still tends to move with Bitcoin's broader trend more than most altcoins of its size.
A steady or rising Bitcoin makes it easier for $DOGE to hold this retest zone, while a sharp Bitcoin drop would make defending support here considerably harder.
Expert Opinion
Traders watching this setup generally agree that a successful retest of broken resistance, especially one lining up with a headline like the X trading news, is the kind of combination that tends to draw fresh buying interest.
The caution is that DOGE is still trading below its 200 EMA even after the breakout, so this dogecoin price prediction forecast leans constructive in the near term without yet confirming a full trend reversal on the daily chart.
Disclaimer: This Dogecoin price prediction is based on technical chart analysis and current market data and should not be treated as financial advice. Cryptocurrency markets are highly volatile, and actual price movements may deviate significantly from projected scenarios. Support and resistance levels discussed represent probability zones, not guaranteed outcomes, and downside risk exists at every stage of this analysis. Readers should conduct independent research before making investment decisions.

















