Chainflip Price Prediction: FLIP Rally, Tokenomics Reset and Risk

Something shifted inside Chainflip this week, and traders searching for a fresh Chainflip price prediction noticed fast. The reason isn't hype; it's a decision the team made about where protocol revenue goes. We checked the chart, wallet data, and announcement to see if this rally has legs.
Why Everyone in the FLIP Community Is Suddenly Talking Tokenomics
Chainflip price prediction chatter rarely spikes without cause. This time it's a tokenomics pivot: burned tokens now flow to stakers instead.
That's a meaningful shift.
Is FLIP a stronger long-term hold now, or just front-loaded buying before the real test comes?
Key Takeaways
FLIP is trading sharply higher after a tokenomics announcement shifted protocol revenue from token burns toward staker rewards.
The daily chart shows an extended breakout with RSI deep in overbought territory, a setup that often cools off before it continues.
Wallet data shows heavy concentration among the largest holders, a risk factor for any short-term Chainflip price prediction.
Weekly swap volume and broker activity both point to real usage growth behind the price move, not just speculation.
The FLIP price prediction outlook below splits into bear, base, and bull cases across three timeframes.
Catalyst: Chainflip Rewrites Its Token Model Mid-Rally
Most tokenomics changes happen quietly. This one landed straight from the Chainflip account: protocol revenue that used to burn FLIP forever will now pay stakers instead.
Bullish for long-term holders locking up supply. Risky since staked rewards can eventually sell, unlike burned tokens. Early reaction has been positive, but whether it holds depends on what happens once the excitement fades.
Where Is Chainflip Trading Right Now
As of August 18, 2026, 06:00 UTC (11:30 AM IST), FLIP is changing hands near $0.4393, up roughly 22% over the past 24 hours. The 24-hour range runs from a low of $0.3579 to a high of $0.4651, and trading volume jumped more than 330% in the same window to about $346.74K.
Market cap sits near $38.93 million with a fully diluted valuation close to $39.54 million since circulating and near-max supply are already tight together at roughly 88.74 million FLIP. Total value locked in the protocol is reported around $13.53 million. For a live, moving snapshot beyond this article, the FLIP market data on CoinMarketCap updates in real time.
Zoom out and the token is still down about 95% from its March 2024 all-time high of $9.48, but it's also up close to 130% from its April 2026 low near $0.19. That's a wide range, and it matters for anyone building a longer-horizon Chainflip price prediction.
FLIP Technical Chart Analysis: Daily Trend, RSI, and EMA Structure
The daily chart tells a clean story. FLIP built a rising base from April through July 2026, holding an ascending trendline the whole way, then broke sharply higher into August. Trading has now cleared the 20-period EMA (a moving average that weights recent trading more heavily) at $0.35682 by a wide margin, confirming short-term momentum.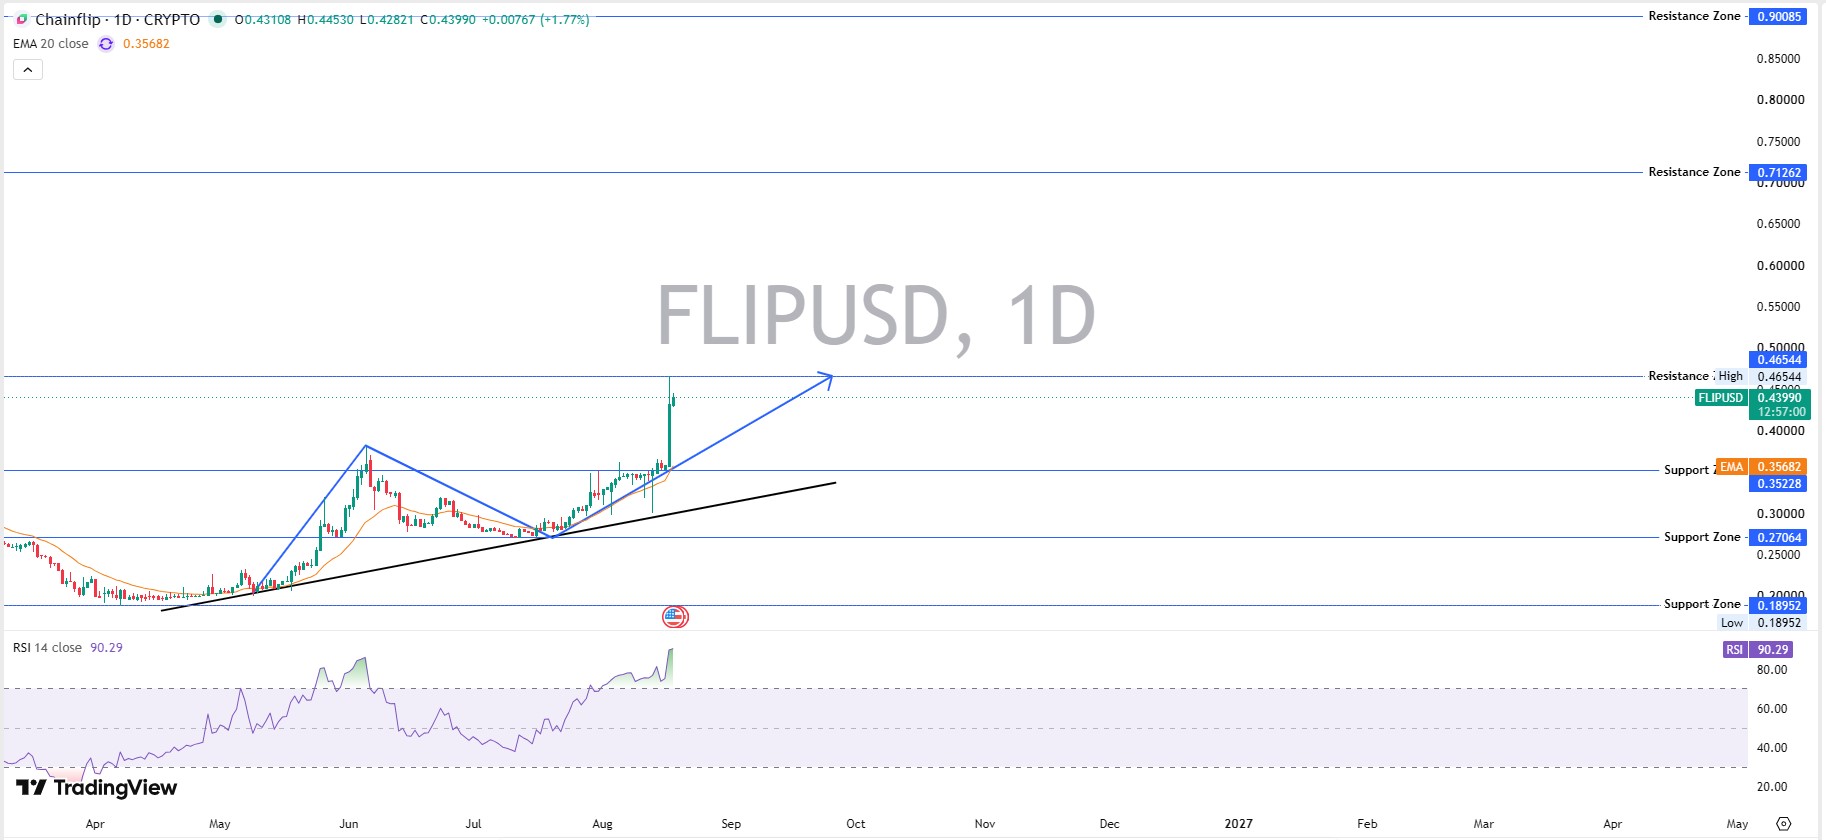
RSI, the Relative Strength Index that measures how stretched a move is, sits at 90.29 on the daily. Anything above 70 is typically read as overbought. Ninety is rare air.
That doesn't mean a reversal is guaranteed. But it does mean the easy part of this rally, the sharp initial breakout, has probably already happened.
Immediate resistance zones sit at $0.46544, then $0.71262, then $0.90085. Support now rests around the EMA near $0.352, with deeper zones at $0.27064 and $0.18952. Anyone charting this independently can cross-check the structure on TradingView's live chart for confirmation.
Whale Concentration and Tokenomics Behind the FLIP Chart
Here's where the Chainflip price prediction picture gets more complicated. On-chain data shows the top 100 wallets hold roughly 94.70% of supply, and wallets classified as whales alone account for about 88.17% of market cap while representing under 1% of holders.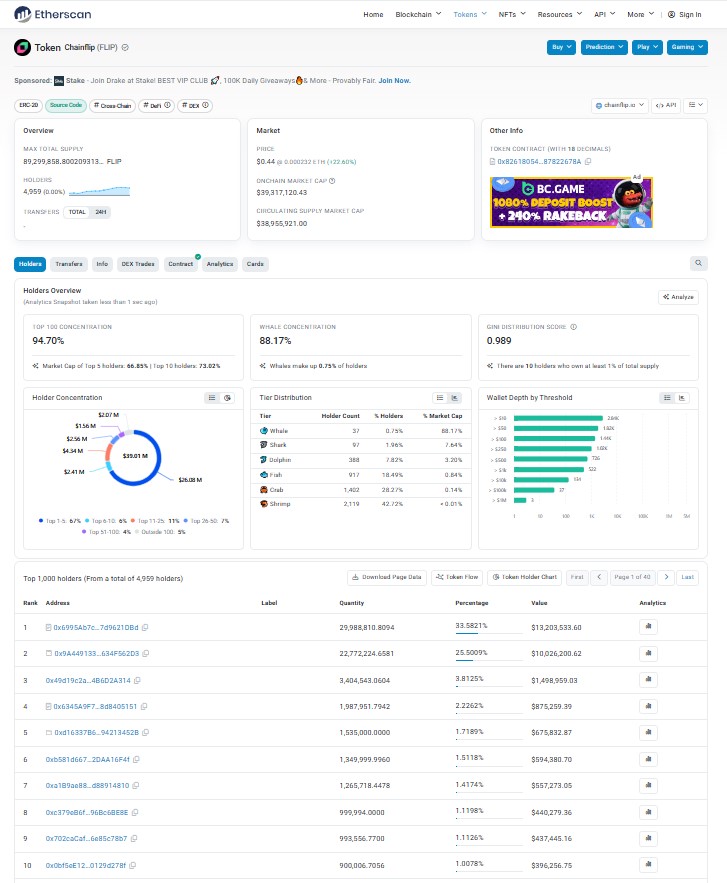
The Gini distribution score, a statistical measure of inequality, comes in at 0.989. For context, a score of 1.0 means total concentration in a single wallet. This is about as concentrated as a token chart gets.
Two individual addresses currently hold roughly 33.6% and 25.5% of total supply between them. That's not automatically a red flag, since large wallets can be exchanges, treasury reserves, or liquidity contracts rather than a single speculator. But it's not confirmed which category these two fall into from public labels, so it stays an open risk rather than a settled one. Readers tracking listing-driven liquidity swings elsewhere can compare notes against recent exchange listing news for how concentrated supply tends to behave post-listing.
Holder count overall sits near 4,959 to 4,960 addresses, a modest base for a token with this much of a daily volume swing.
Chainflip Broker and Swap Data: The Altcoin Angle
FLIP isn't a meme token riding pure attention. It's an infrastructure altcoin, and its price prediction case leans heavily on actual protocol usage, which is where the recent numbers get interesting.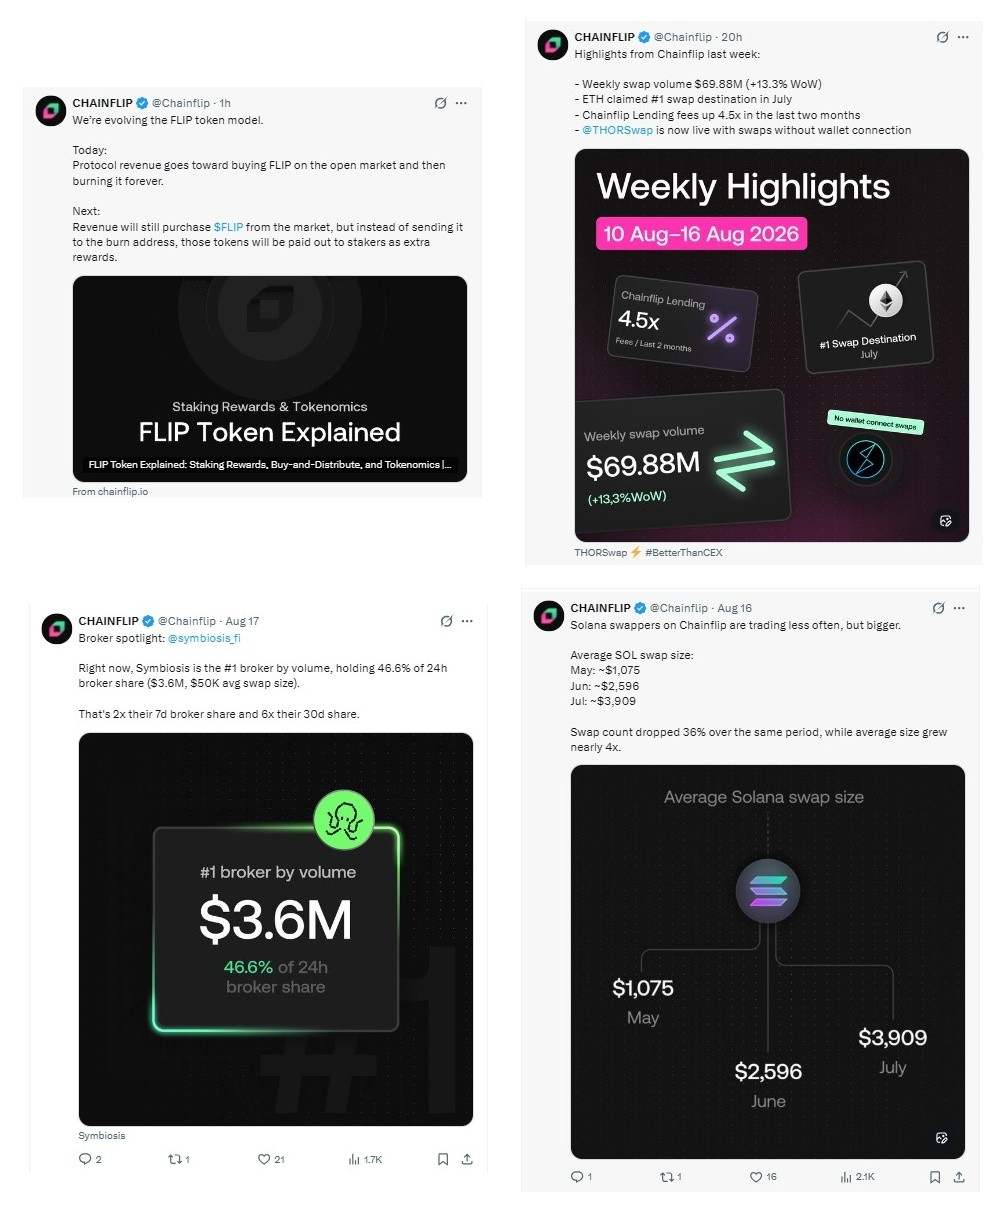
Weekly swap volume through Chainflip hit $69.88 million for the week of August 10 to 16, up 13.3% week over week, according to the team's own weekly recap. Ethereum claimed the top swap destination spot in July, and lending fees on the platform are up 4.5x over the last two months.
Broker-level data adds another layer. One routing partner alone handled 46.6% of 24-hour broker volume this week, roughly $3.6 million, which is double its 7-day share and six times its 30-day share. Solana swappers, meanwhile, are trading less often but in much bigger sizes, with the average swap value climbing from around $1,075 in May to near $3,909 in July even as the swap count dropped 36%.
Fewer trades, bigger tickets. That's usually a sign bigger players are stepping in.
This kind of usage growth is the piece a purely technical FLIP price prediction would miss entirely. Investors comparing this altcoin cycle against broader token unlock and airdrop activity can browse the crypto airdrops tracker for related supply events worth watching this quarter.
Chainflip Price Prediction: Bear, Base and Bull Scenarios
Putting the chart, the tokenomics shift, and the usage data together, here's how the Chainflip price prediction breaks down across three timeframes. None of this is a guarantee, and every scenario carries a level that would invalidate it.
Timeframe | Bear Case | Base Case | Bull Case | Probability | Invalidation |
7 Days | $0.36–$0.39 | $0.42–$0.47 | $0.50–$0.58 | Bear 30% / Base 45% / Bull 25% | Daily trades close below $0.352 |
30 Days | $0.28–$0.33 | $0.40–$0.53 | $0.60–$0.71 | Bear 30% / Base 45% / Bull 25% | Weekly trades close below $0.27 |
Early 2027 | $0.19–$0.23 | $0.45–$0.65 | $0.85–$0.90 | Bear 25% / Base 45% / Bull 30% | Loss of the ascending trendline structure since April 2026 |
The base case assumes the tokenomics shift keeps attracting stakers while momentum cools off from its current overbought extreme. The bull case needs continued swap volume growth and a clean break of the $0.465 resistance zone to stay alive. For a wider set of forecasts across other tokens this cycle, the price prediction hub covers comparable setups.
Key Risks to the Chainflip Forecast
Extreme wallet concentration remains the biggest structural risk. If either of the two largest holders begins distributing, the price could move faster than the chart's technical levels suggest.
RSI above 90 also raises short-term pullback risk regardless of the fundamental story. And the tokenomics change itself is unproven at scale, since paying stakers instead of burning supply is a design that hasn't run through a full market cycle yet.
Macro conditions matter too. Broader shifts in United States crypto policy, including ongoing Clarity Act developments and changing signals from Federal Reserve leadership, can swing risk appetite for smaller-cap altcoins like FLIP regardless of project-specific news.
Disclaimer
This article is for informational purposes only and does not constitute financial, investment, or trading advice. Cryptocurrency markets, including FLIP, are highly volatile, and prices can move sharply in either direction without warning.
Wallet concentration, tokenomics changes, and technical indicators discussed here reflect data available at the time of writing and can change quickly. Always do your own research and consult a qualified financial advisor before making investment decisions.
Also read:







.webp)








