DeFi App Price Prediction 2026: Can $HOME Reclaim $0.01?


Something is happening with $HOME that most price trackers are only now catching up to. A token that spent weeks bleeding quietly just ripped higher out of nowhere, and the reaction split traders down the middle almost instantly. Some are calling it the start of a real recovery. Others think it is a dead-cat bounce dressed up as a breakout. What actually happened underneath the surface, and does it hold?
HOME ripped higher, but the short-term chart tells a different story.
This DeFi App price prediction opens with a split screen, not a single headline. The token just posted its biggest daily move in weeks, and the most recent candle already gave a chunk of it back.
Traders who bought the pump are asking if this is the bottom.
And traders who missed it are asking whether chasing it now even makes sense.
What separates this from a random spike is the wallet data sitting underneath the chart. So which chart is telling the truth here, the one screaming recovery or the one warning of a fade?
Key Takeaways
HOME trades near $0.0085, up roughly 28% in 24 hours per CoinMarketCap, still about 87.62% below its June 2026 all-time high.
The token bottomed just five days ago and has already rallied close to 78% off that low.
Weekly RSI reads 38.90, still under the midline even after the bounce.
Top 100 wallets hold 99.87% of tracked supply, with whale wallets alone controlling 95.68%.
Invalidation for the bullish case sits under $0.00727 on the short-term chart.
Why HOME Is Moving Today
HOME trades near $0.0085 after CoinMarketCap data logged a near 28% daily gain. Turns out the move traces back to a bounce off a fresh all-time low set just five days earlier, the kind of setup momentum traders chase fast.
But the 4-hour candle that just closed tells a cooler story. Price ran from near $0.0095 down to $0.0085, a pullback of about 10%, right into a broadening wedge, the kind of pattern where highs and lows stretch wider instead of narrowing. That points to rising volatility, not a settled trend.
DeFi App Technical Analysis: 4-Hour Chart
When we pulled up the 4-hour HOMEUSDT chart, the first thing that stood out was how far price had run before this pullback started. The broadening wedge stretching back two weeks has widened with every swing, and $HOME now sits near its middle at $0.00853.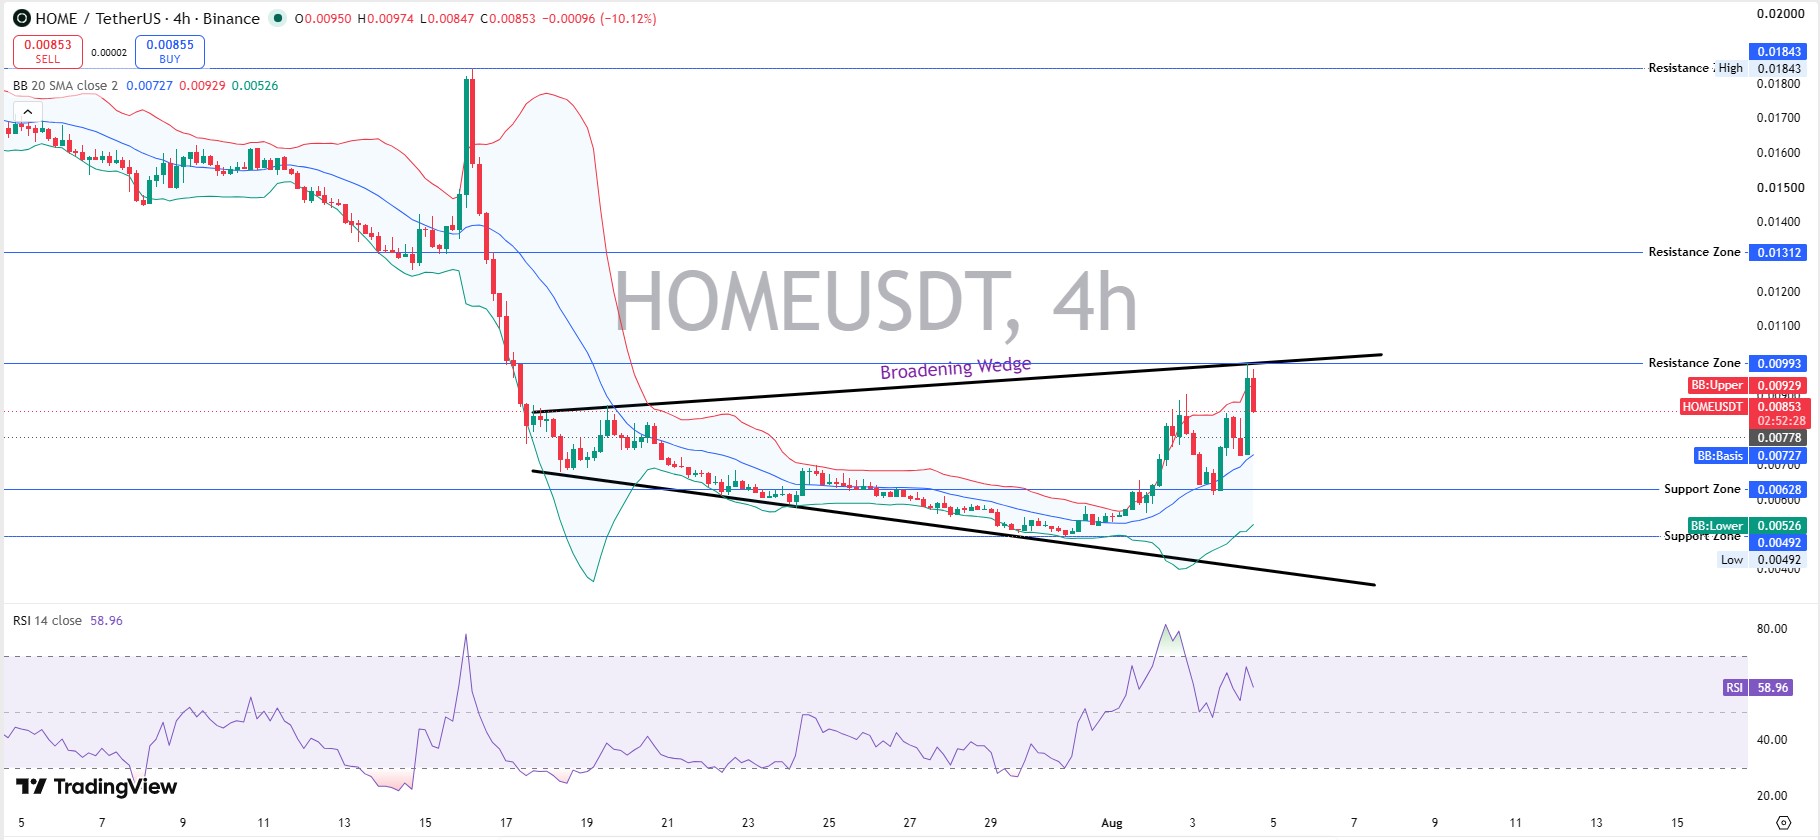
Resistance stacks at $0.00929, the upper Bollinger Band; then $0.00993; and then a heavier zone at $0.01312. The recent high sits near $0.01843.
Support holds at $0.00727 first. Lose that and $0.00628 comes into play, with a deeper floor at $0.00526 and $0.00492.
Four-hour RSI reads 58.96, warm but nowhere near overbought. A reclaim of $0.00929 keeps the bounce alive. Losing $0.00727 flips this read bearish fast.
DeFi App Technical Analysis: Weekly Chart
Zoom out and the picture changes. HOME closed the week at $0.00876, up 20%, still stuck inside a descending channel that has capped every rally since last year.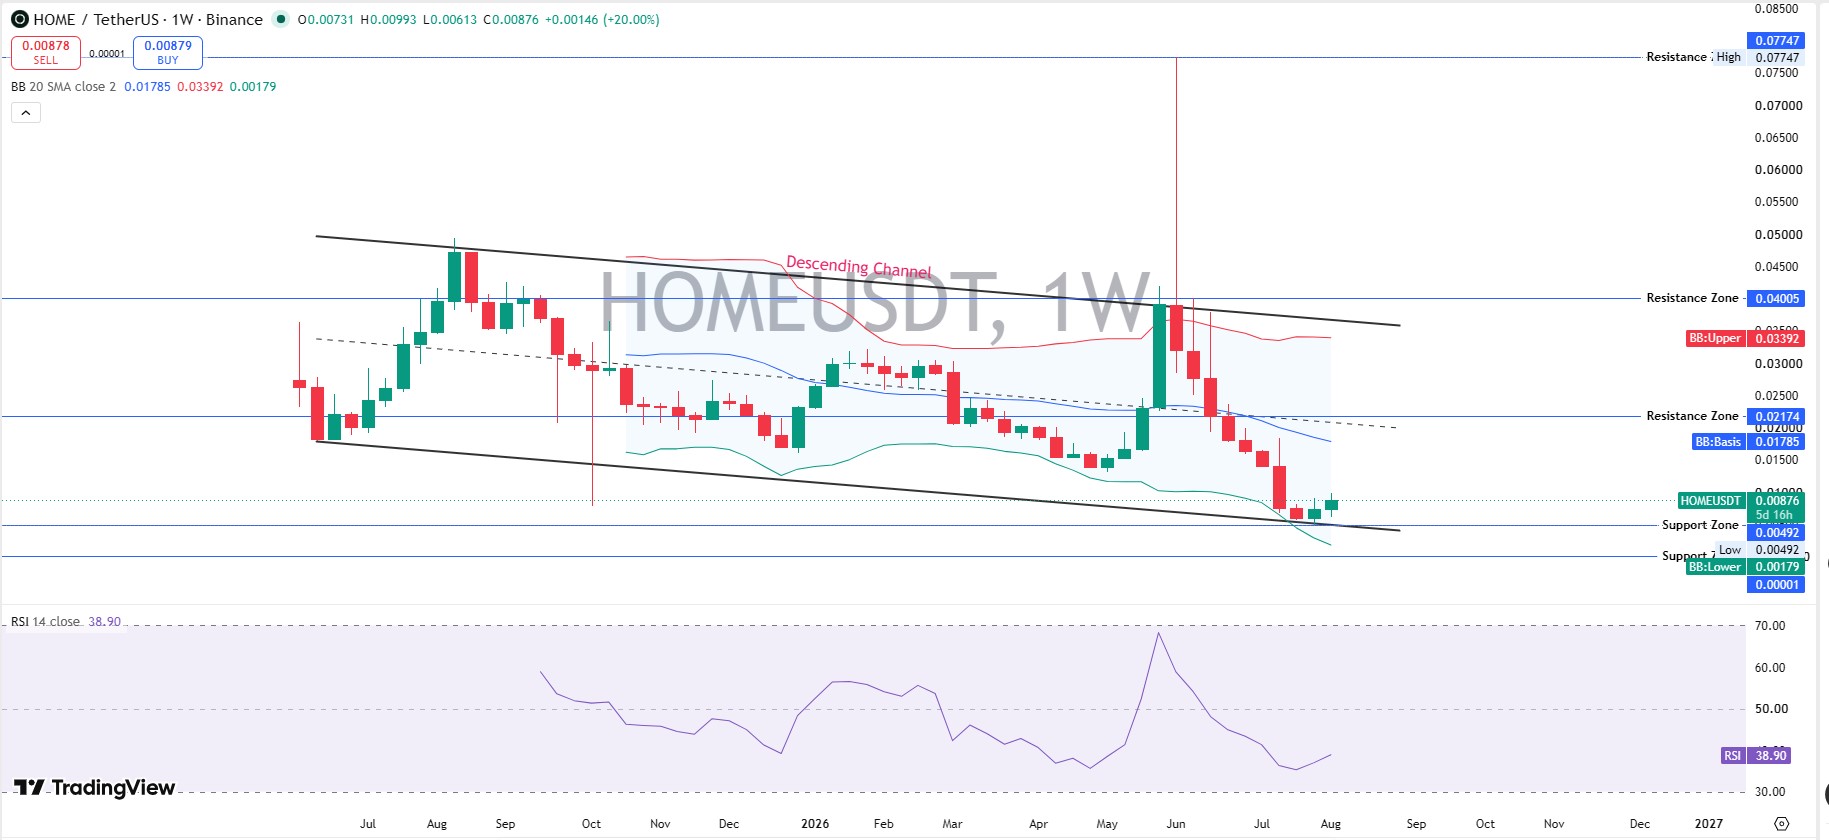
Weekly resistance sits at $0.01785, then a thicker zone near $0.02174, and then $0.03392, the upper Bollinger band. The prior high near $0.07747 remains a long way off.
Weekly RSI at 38.90 has room to run before hitting overbought, unlike the shorter chart. That gap usually decides whether short-term buyers can outrun a weekly trend that is still technically bearish.
Fine. That is the tension driving this whole setup right now.
$HOME Support And Resistance Levels
Immediate support: $0.00727, then $0.00628, then $0.00526, then $0.00492. Immediate resistance: $0.00929, then $0.00993, then $0.01312, then $0.01843.
DeFi App Price Prediction: Scenarios By Timeframe
Timeframe | Bull Case | Base Case | Bear Case |
24H | Reclaims $0.00929, tests $0.00993 (moderate) | Chops $0.0075-$0.0090 (high) | Slips under $0.00727 (low-moderate) |
7D | A weekly close above $0.01312 opens $0.01785 (low-moderate) | Range-bound inside the channel (high) | A weekly close under $0.00628 revisits $0.00492 (moderate) |
2026 | Breaks $0.02174, retests $0.03392 (low) | Drifts $0.006-$0.012 tracking volume (moderate) | Falls back to $0.00492, risks a new low (low-moderate) |
Invalidation for this bullish DeFi App price prediction is a close under $0.00727 on the 4-hour chart, or a weekly close under $0.00492.
Tokenomics And Whale Concentration
HOME has a 10 billion max supply, with roughly 4.27 billion circulating, giving a market cap near $36.45M and an FDV near $85.24M. Tokenomics documentation shows 47% of supply is reserved for the community and ecosystem, unlocking over 36 months.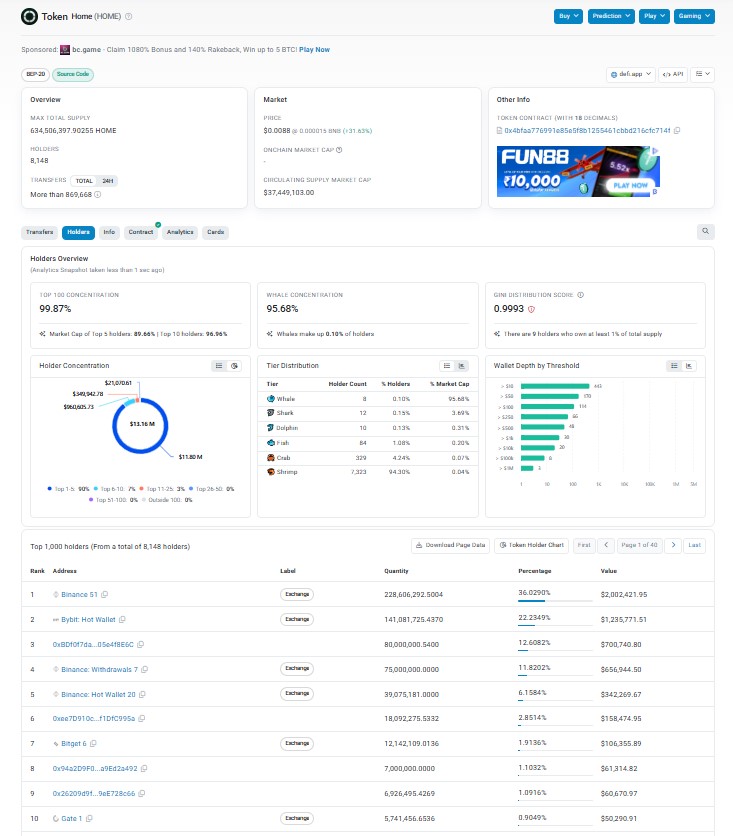
Liquidity-to-market-cap runs thin at 0.49%, and that matters more than most metrics here.
On-chain concentration runs extremely too. Per BscScan holder tracking, the top 100 wallets hold 99.87% of the tracked supply, and whale wallets alone, just 0.10% of holders, control 95.68%. The Gini score reads 0.9993, about as skewed as it gets.
That concentration should shape how anyone reads this DeFi App price prediction.
Liquidations And Exchange Volume
The numbers came in fast today. Per CoinGlass-style tracking, 24-hour liquidations hit $2.02M, split between $797.96K in longs and $1.22M in shorts. Shorts took the bigger hit.
Binance carries the heaviest futures volume at $233.65M, with OKX near $150.06M and LBank around $91.73M. Real derivatives activity, building around a token that barely had a chart three weeks ago.
HOME And The Altcoin Narrative
HOME sits inside the broader DeFi altcoin group, tokens tied to on-chain protocol activity rather than a single listing. That framing pulls in buyers whenever altcoin risk appetite improves, and it works against HOME just as fast when it does not.
A rally this sharp on a sub-$40M market cap does not confirm a trend reversal by itself. Broader sentiment around a bitcoin price prediction 2026 still sets the tone for how far small altcoins like HOME can run.
DeFi App Market Outlook: Risks To Watch
Whale concentration tops the list. A handful of wallets controlling 95%-plus of tracked supply means one large transfer could reshape the order book without warning.
And thin liquidity against that concentration makes slippage worse both ways.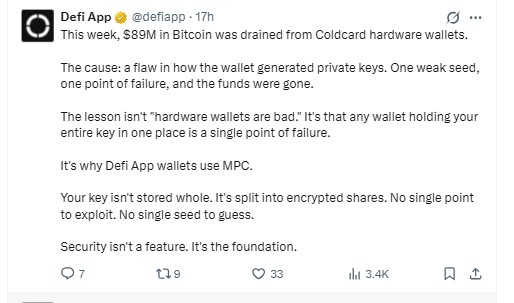
Here's the thing: HOME's team has also pushed a security angle after $89M in Bitcoin drained Coldcard hardware wallets this week, pointing to its own MPC wallet design as the alternative to single-key storage. Fair point on architecture. It says nothing about whale risk, though.
Coverage around the Fed rate decision and ongoing Clarity Act developments tend to move small-cap altcoins fast, HOME included. New listings can exaggerate moves too, so an exchange listing tracker and a coin events calendar for upcoming unlocks are both worth bookmarking.
Methodology: Chart levels came from HOMEUSDT 4-hour and weekly charts using RSI-14 and 20-period Bollinger Bands, captured on August 4, 2026, around 09:00 UTC. Price and market-cap data came from CoinMarketCap on the same day, at the same time. Holder and Gini data came from BscScan for contract 0x4bfaa776991e85e5f8b1255461cbbd216cfc714f. Liquidation and volume figures came from CoinGlass-style tracking.
Disclaimer: This is speculative market commentary, not financial or investment advice. Crypto assets are volatile and can lose most or all of their value. Verify live figures before trading.


















