CORN Price Prediction: Token Breaks Out of Descending Channel


CORN price prediction searches are climbing after the token jumped more than 32% in a single day, breaking out of a descending channel it had been stuck in since early this year. This CORN crypto price prediction looks at where the token sits right now, what the charts say, and how concentrated the holder base is before laying out realistic price targets. The move lands during a broader stretch where crypto market rally today coverage has been tracking risk appetite returning across majors and altcoins alike.
Unlike a brand-new launchpad token, CORN has real chart history behind it. The token hit its all-time high roughly ten months ago and has spent most of 2026 grinding lower inside a well-defined descending channel until today's move, which pushed price back above a key short-term resistance zone. That context matters for anyone searching for a CORN price prediction today, since a breakout from an established downtrend reads very differently than the kind of launch-window hype tracked around the Pepeto presale countdown.
Why CORN Is Back On Traders' Radar
CORN jumped over 32% in 24 hours, changing hands around $0.0393–$0.0394, with the move showing up clearly on both the 4-hour and weekly charts, according to live data on the CORN CoinMarketCap page. The most recent weekly candle alone is up more than 67%, one of the sharpest weekly moves in the token's history.
The rally comes after a long slide: CORN is still down roughly 70% from its all-time high but has more than doubled off its all-time low set just a few months ago. That combination, a deep drawdown from the highs paired with a strong bounce off the lows, is a setup similar to the reversal pattern covered in the XRP resistance rejection analysis, and it's exactly the kind of move that tends to trigger a wave of CORN future price prediction searches.
Token Contract
-
Contract Address: 0x44f49ff0da2498bcb1d3dc7c0f999578f67fd8c6
-
Standard: ERC-20
-
Implementation Contract: 0x40429A82d62497fe7Ed61Cd5AC68894328B3BE30
-
Chain: Ethereum
-
CertiK Rating: 4.4 / 5
-
Explorer: cornscan.io
CORN uses a standard proxy architecture, a widely used design pattern in modern ERC-20 deployments that keeps the token contract flexible and future-ready. Full contract details, transfers, and holder history are viewable on the CORN Etherscan token page.
Key Takeaways
-
CORN trades near $0.0393–$0.0394 as of July 24, 2026, up roughly 32% in 24 hours.
-
The token is about 70% below its all-time high of $0.133, set roughly ten months ago (October 3, 2025).
-
It's up over 109% from its all-time low of $0.01891, set about four months ago (March 22, 2026).
-
4-hour chart resistance sits at $0.04463, with a bigger wall at $0.06100. Support sits at $0.02229, with a deeper zone near $0.01001.
-
4-hour RSI reads 84.18, solidly overbought, while weekly RSI sits at a much cooler 44.04.
-
Market cap sits around $20.6–20.7M, with fully diluted valuation between roughly $78.5M and $82.7M depending on which total supply figure is used.
-
24-hour volume runs around $2.6M, down about 21% even as price rallies, putting volume-to-market cap around 12.6%.
-
Holder count sits around 890–896 addresses, with supply heavily concentrated among a small group of wallets.
Where CORN Stands Right Now
CORN last traded around $0.0393–$0.0394, up roughly 32% over the past 24 hours, per the CORN CoinMarketCap page. On the 4-hour chart, the most recent candle closed at $0.03855, up about 6.6% on that timeframe alone, while the weekly candle closed at the same level after opening near $0.02306, a gain of roughly 67% on the week.
Total and circulating supply figures diverge slightly across trackers, similar to the kind of ambiguity that shows up in the supply-unlock discussion within the Ethereum price outlook 2026. One tracker lists total and max supply at 2.1 billion CORN against roughly 525 million circulating; the on-chain explorer instead shows a max total supply closer to 1.995 billion.
That gap changes the fully diluted valuation math meaningfully, from about $78.5M using the on-chain figure to about $82.6–82.7M using the 2.1 billion figure, so it's worth double-checking before leaning too heavily on any single FDV number.
The all-time high of $0.133 was set about ten months ago, on October 3, 2025, and the current price sits roughly 70% below that peak, a much longer, deeper drawdown than a freshly launched token would show and a reminder that this CORN price prediction 2026 has to account for a real multi-month downtrend, not just a launch-week chart.
The all-time low of $0.01891 was set about four months ago, on March 22, 2026, meaning the current price is up over 109% from that low, a bounce comparable in scale to the recovery discussed in recent Solana price momentum coverage.
What's Driving CORN's Price Today
The clearest driver is technical: CORN had been trading inside a descending channel for months, with lower highs and lower lows since early 2026. Today's move pushed price out of that channel and back above the $0.04463 zone that had capped previous rally attempts, which is often enough on its own to draw fresh buying interest and search volume around any CORN crypto forecast, a dynamic not unlike the setup covered in the Solana eTrade listing prediction.
Volume tells a slightly more cautious story. Even with the sharp price move, 24-hour volume actually fell roughly 21%, which means this breakout has come on lighter participation than the price change alone would suggest, a pattern worth watching for anyone building a CORN price forecast around continuation versus a false breakout, in the same way sharp drawdowns get scrutinized in the Iran truce crypto crash report.
Technical Analysis: 4-Hour Chart
The 4-hour CORN/USD chart, visible on the CORN chart on GeckoTerminal, shows price spending roughly two months compressed inside a descending channel between the EMA and the lower channel boundary before spiking sharply higher in the most recent sessions, breaking both the channel's upper trendline and the $0.04463 resistance zone in the same move.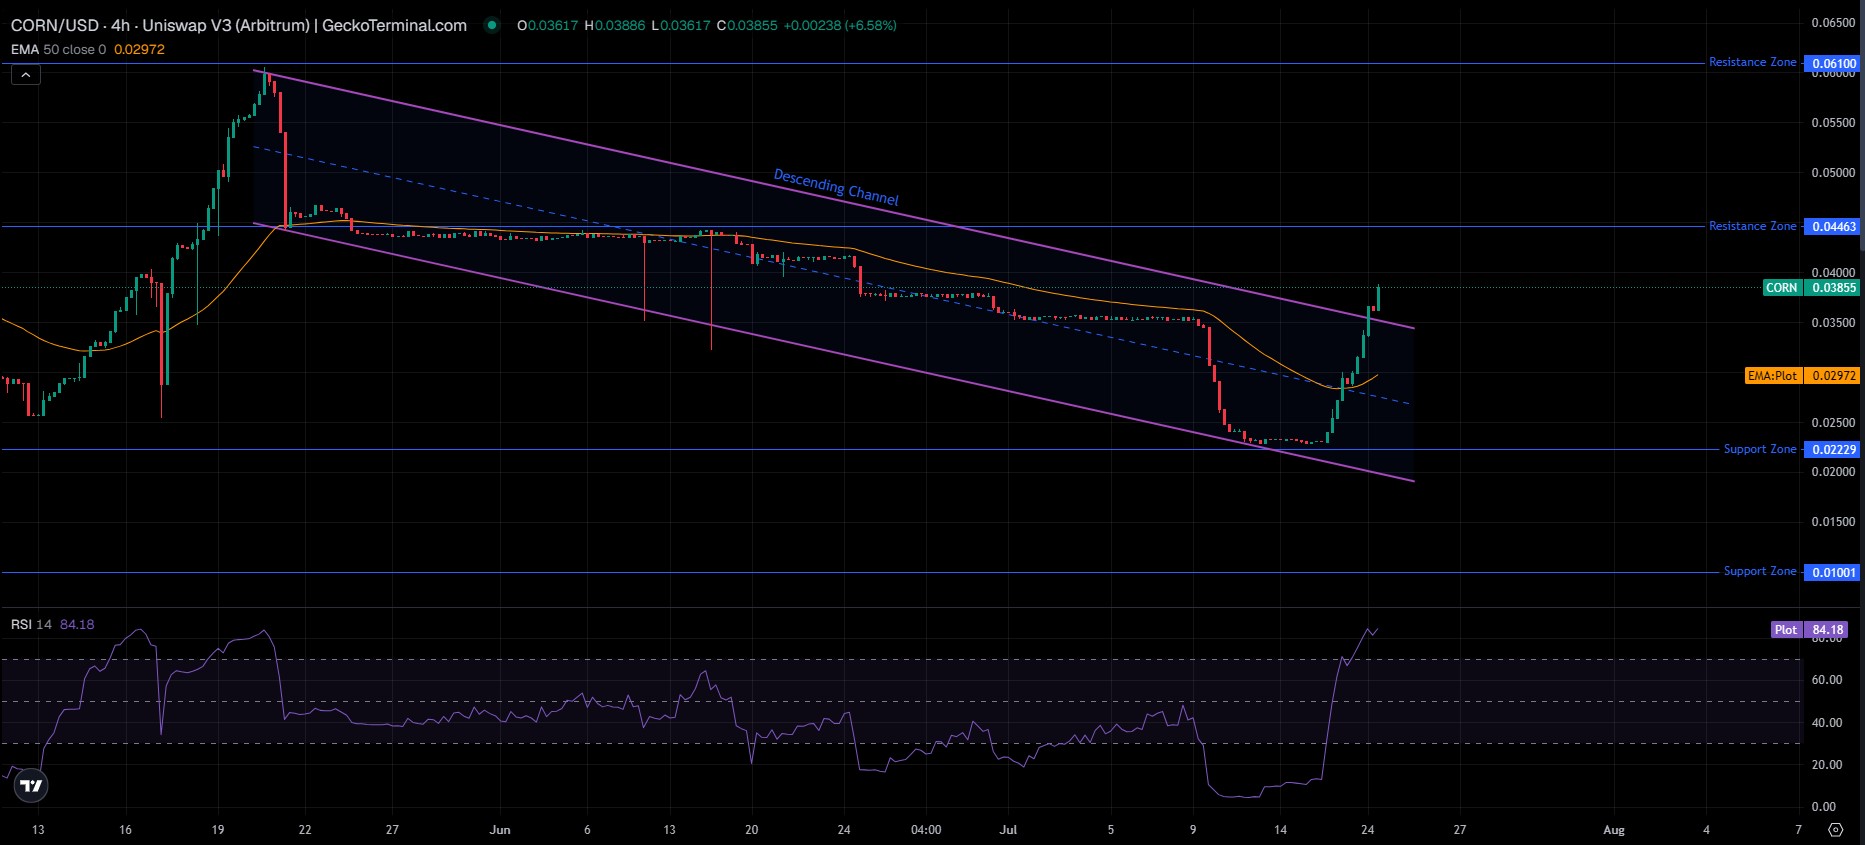
The 50-period EMA sits at $0.02972, well below the current price, a bullish signal on its face, though the size of the gap also shows how far price has moved in a short window. RSI on the 4-hour chart reads 84.18, deep into overbought territory, which is the main technical caution flag on this timeframe, similar to the momentum extremes flagged in the Bitcoin bull bear case outlook. Resistance sits at $0.04463, with a bigger zone at $0.06100. Support sits at $0.02229, backed by a deeper floor at $0.01001.
Support and Resistance Snapshot (4H)
| Level Type | Price |
|---|---|
| Resistance 2 | $0.06100 |
| Resistance 1 | $0.04463 |
| Current Price | $0.03855 |
| Support 1 | $0.02229 |
| Support 2 | $0.01001 |
Technical Analysis: Weekly Chart
The weekly chart tells a different story than the 4-hour timeframe and is the more important one for a longer-range CORN price prediction 2027 outlook. 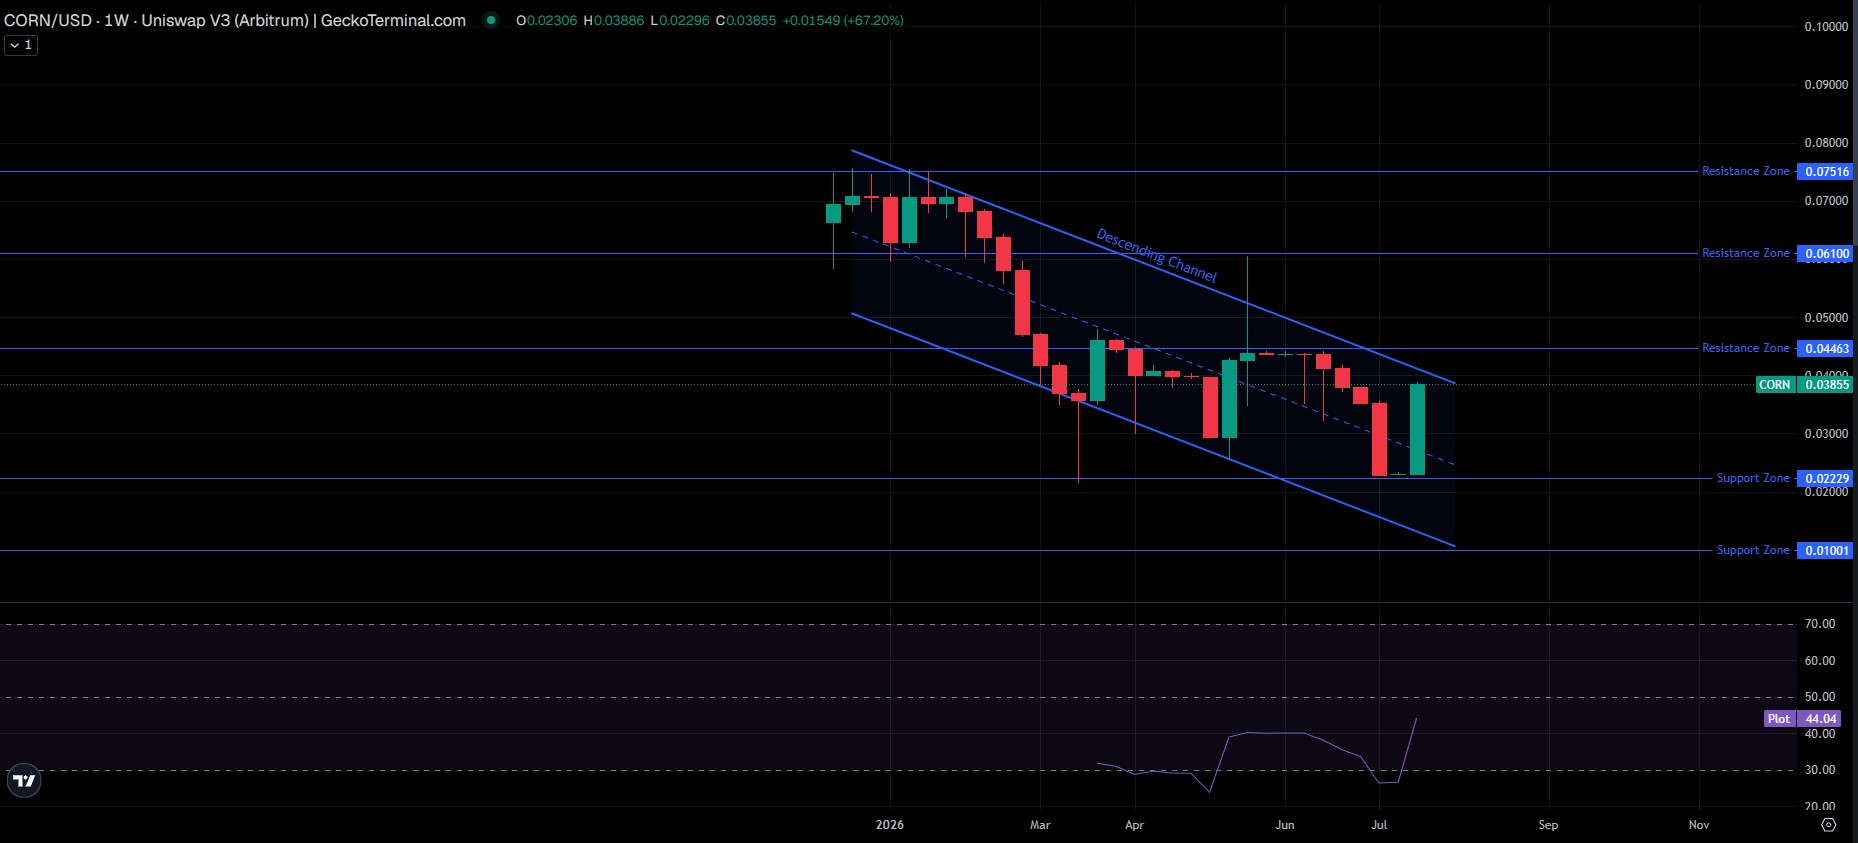
Price has been inside a descending channel since roughly the start of 2026, opening this week at $0.02306, running up to a high of $0.03886, dipping to a low of $0.02296, and closing near $0.03855, a nearly 67% weekly gain, but one that only brings price back to the upper boundary of the multi-month downtrend rather than clearly out of it, per the same CORN chart on GeckoTerminal viewed on its weekly timeframe.
The weekly RSI sits at 44.04, still below the neutral 50 line, unlike the overbought 4-hour reading, suggesting the longer-term trend has room to run before it would be considered stretched, a structural contrast worth reading alongside the multi-year context in the Bitcoin price forecast. The same resistance and support zones apply on the weekly view, with an additional resistance zone further out at $0.07516.
Support and Resistance Snapshot (Weekly)
| Level Type | Price |
|---|---|
| Resistance 3 | $0.07516 |
| Resistance 2 | $0.06100 |
| Resistance 1 | $0.04463 |
| Current Price | $0.03855 |
| Support 1 | $0.02229 |
| Support 2 | $0.01001 |
Tokenomics and Holder Concentration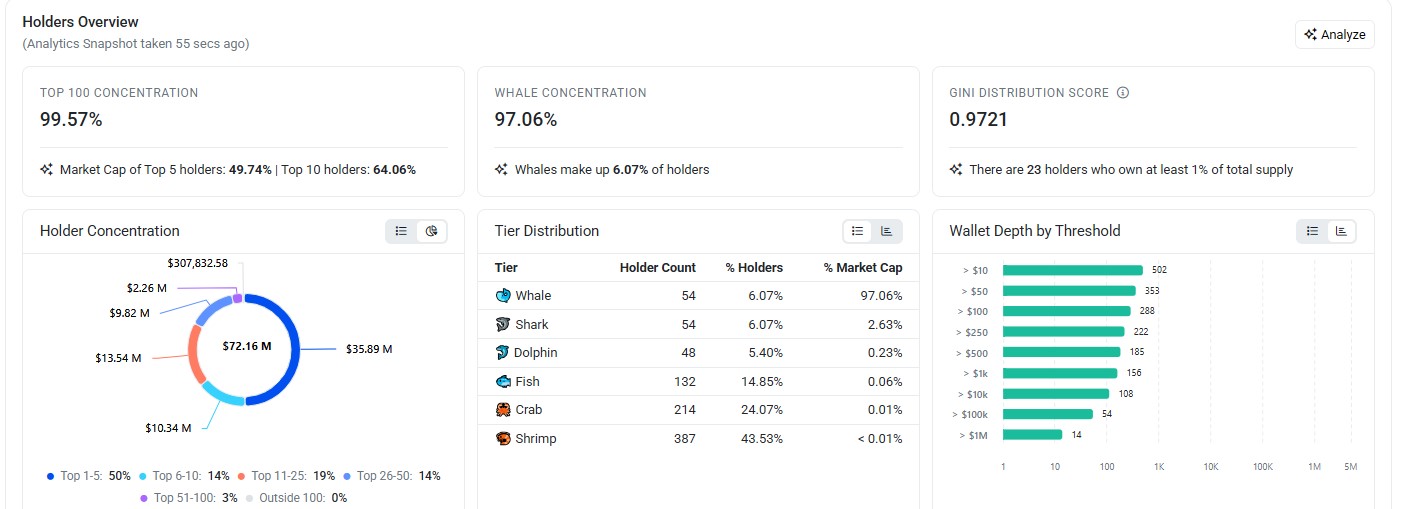
Total supply sits at either 2.1 billion or roughly 1.995 billion CORN, depending on the source, with circulating supply around 525 million. Holder count sits around 890–896 addresses, as tracked on the CORN Etherscan token page.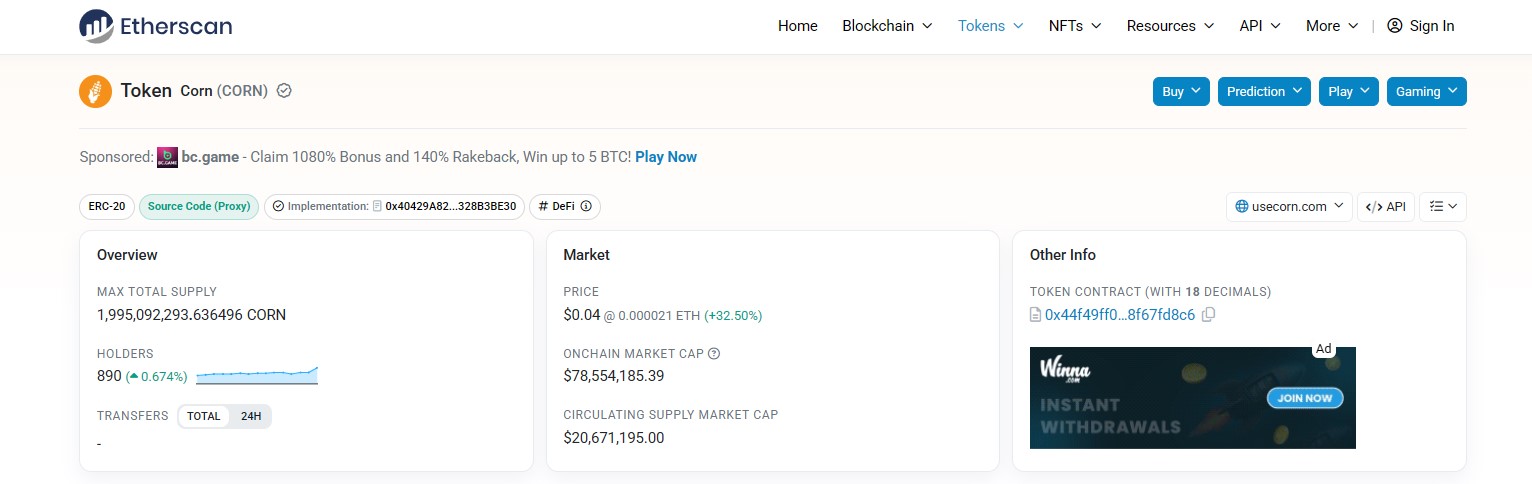
Concentration here is notably high, and unlike some newer tokens, none of the largest wallets are confirmed burn addresses or labeled liquidity contracts. The single largest holder controls about 23.39% of supply, the second-largest about 8.41%, and the top 10 wallets combined hold roughly 64.06% of total supply.
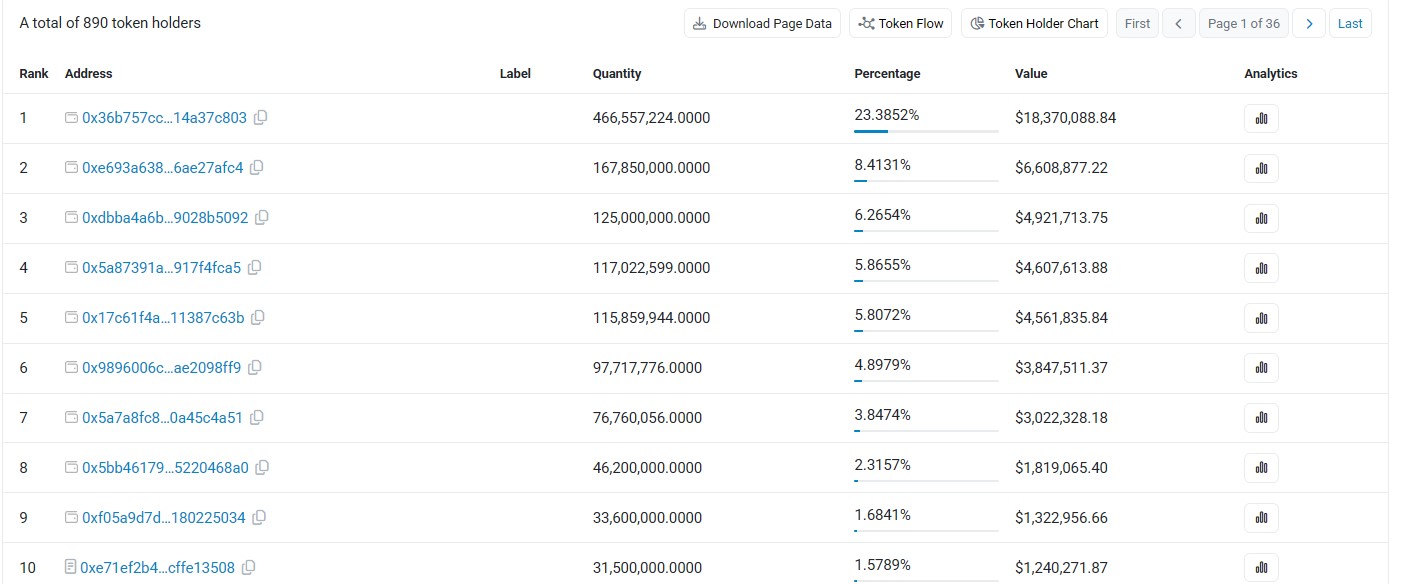
Holder analytics put whale concentration at 97.06% of market cap held across just 54 whale-tier addresses, with a Gini distribution score of 0.9721, a very high concentration reading on a 0-to-1 scale, and a pattern worth watching in the same way the XRP whale accumulation data has been tracked. Twenty-three individual holders each control at least 1% of total supply.
That level of concentration is the single biggest factor to weigh against any bullish CORN token forecast: a small number of wallets have the ability to move the market significantly if they choose to sell into strength.
Liquidity and Volume
24-hour volume sits around $2.6M against a roughly $20.7M market cap, a volume-to-market-cap ratio of about 12.6%, with pair-level data visible on the CORN Uniswap trading pair. That volume figure is down about 21% even as price rallied 32%, a divergence worth watching; strong price moves on falling volume can sometimes fade faster than moves backed by rising participation, a dynamic also shaped by protocol-level flows like the ones covered in the Uniswap fee buyback update. Some individual trading-pair pages show much lighter daily volume on specific pools, a reminder that liquidity can vary a lot pair-by-pair even for the same token.
Bull, Base, and Bear Scenarios
These are scenario-based estimates built from the current chart structure, not guarantees or financial advice, framed similarly to the Bitcoin to Ethereum rotation trade discussion.
Bull Case: A clean break and hold above $0.04463 opens a path toward $0.06100, and a weekly close above that zone could extend the move toward $0.07516. Probability: moderate, roughly 30%, contingent on volume picking back up to confirm the breakout.
Base Case: Price consolidates roughly between $0.030 and $0.045 as the overbought 4-hour reading cools off and the market decides whether the channel breakout holds. Probability: highest, roughly 45%.
Bear Case: The overbought 4-hour RSI resolves with a pullback, and price retests the $0.02229 support zone, with a deeper test of $0.01001 possible if the breakout turns out to be a false one. Probability: roughly 25%.
Price Forecast Table
| Timeframe | Bear | Base | Bull |
|---|---|---|---|
| 24H | $0.033 | $0.039 | $0.045 |
| 7D | $0.028 | $0.038 | $0.052 |
| 30D | $0.020 | $0.036 | $0.065 |
| 2026 (Year-End) | $0.012 | $0.040 | $0.090 |
Key Risks
-
Overbought short-term momentum. A 4-hour RSI of 84.18 is deep into overbought territory, and moves this stretched often see at least a partial pullback before continuing.
-
Falling volume on a rising price. Volume dropped roughly 21% even as price rose 32%, a divergence that can signal weaker conviction behind the move.
-
Heavy, unlabeled holder concentration. With no confirmed burn address or locked liquidity wallet among the largest holders, the top 10 wallets controlling roughly 64% of the supply represent a real, ongoing source of potential sell pressure.
-
Supply figure ambiguity. The total supply is listed as either 2.1 billion or roughly 1.995 billion depending on the source, which changes fully diluted valuation calculations meaningfully.
-
Long-term downtrend still intact. Despite today's move, the price remains roughly 70% below its all-time high and inside a descending channel on the weekly chart that hasn't been decisively broken yet. Worth tracking alongside the crypto events calendar for anything that could shift sentiment either way.
Glossary
-
RSI (Relative Strength Index): A 0-100 momentum indicator. Above 70 typically signals overbought; below 30 signals oversold.
-
EMA (Exponential Moving Average): A trend-following average weighting recent prices more heavily.
-
FDV (Fully Diluted Valuation): What the market cap would be if all tokens were circulating.
-
Proxy Contract: A widely used smart contract design where the token address stays fixed while the underlying logic contract can be maintained separately, commonly used across modern ERC-20 tokens.
-
Gini Distribution Score: A measure of supply inequality among holders, where scores closer to 1 indicate high concentration among few wallets.
Disclaimer: This article is for informational purposes only and does not constitute financial advice. Cryptocurrency markets are highly volatile, and tokens with concentrated holder bases carry additional risk. Always do your own research and consult a licensed financial advisor before making investment decisions.
Also read:

















