DIA Price Prediction: Token Rallies Hard on Short Squeeze Surge


Something quiet just turned loud. A token that had been drifting near its lowest point in years suddenly ripped higher, and anyone searching for a DIA price prediction today already knows why. That kind of reversal doesn't happen without a reason, and the reason here isn't a listing headline or a partnership announcement. It's leverage unwinding hard, all at once.
So what actually flipped the switch, and does it hold? Anyone tracking recent crypto news this week has probably already noticed the pattern repeating across more than one small-cap chart.
Why DIA Suddenly Has Traders Watching Every Candle
DIA price prediction searches have picked up sharply this week, and it's not hard to see why once you look past the headline move. A coin that had been ignored for months, sitting near territory it had never visited before, just staged one of its biggest single-day runs in a long time.
That's the kind of chart pattern that pulls in both believers and skeptics fast, and it's exactly the setup covered in our broader price prediction coverage this week.
Traders who'd bet against the coin got squeezed out of their positions, and that forced buying added its own fuel to an already hot move. Was this the start of something real, or just leverage clearing itself out before the price settles back down?
Table of Contents
-
Key Takeaways
-
Token Contract
-
Where DIA Stands Right Now
-
What's Driving DIA's Price Today
-
Technical Analysis: 4-Hour Chart
-
Technical Analysis: Weekly Chart
-
The Short Squeeze, In Real Time
-
Tokenomics and Holder Concentration
-
Liquidity and Exchange Volume
-
Bull, Base, and Bear Scenarios
-
Price Forecast Table
-
Key Risks
-
Glossary
Key Takeaways
DIA trades near $0.1795 as of the latest CoinMarketCap snapshot, up roughly 23% in 24 hours, with a 24-hour range of $0.125 to $0.2025.
The 4-hour chart broke clean out of a months-long descending triangle. The RSI on that timeframe reads 90.22, deeply overbought.
The weekly RSI sits at just 48.21, still below the neutral midline, even after a candle that's up 28.2% for the week. That gap matters.
4-hour resistance sits at $0.2183, then $0.2369. Support sits at $0.1344, then $0.0986.
Liquidations hit $985.18K over 24 hours, and shorts took the larger share in every single window, from one hour out to a full day.
The circulating supply is 119.67M DIA against a 200M max supply. Etherscan lists total supply closer to 168.81M, so a meaningful chunk of tokens still sit outside circulation.
Holder data shows real concentration. The top 100 wallets control roughly 89% of tracked supply, and a burn address alone holds over 15% of everything in circulation.
Token Contract
Contract Address: 0x84ca8bc7997272c7cfb4d0cd3d55cd942b3c9419
Standard: ERC-20 Security
Rating: CertiK 4.3 / 5
Full contract and holder details are verifiable on the Etherscan token page directly.
Where DIA Stands Right Now
DIA last changed hands between $0.1795 and $0.187, depending on the venue checked, a spread visible when comparing the CoinMarketCap DIA page against live chart data. Up around 23% to 28% over the past 24 hours, depending on which candle you're reading. Volume came in near $45.48M against a market cap of $21.49M, a vol-to-market-cap ratio above 193%, which is extreme turnover for a token this size.
And here's what really stands out. DIA's all-time low, $0.09784, was set just two days ago, on July 25, 2026. The price now sits more than 103% above that floor, a breakout speed similar to what we saw covered in the recent Shiba Inu price prediction breakout piece.
This isn't a coin bouncing off an old chart level nobody remembers. It's a coin that bottomed this week and is already doubling off it. The all-time high, by contrast, sits way up at $5.79, set back in May 2021. Current price is still roughly 96.6% below that peak.
Turns out, distance from an all-time high of 5 years old doesn't mean much when the more relevant question is what happens over the next few days.
What's Driving DIA's Price Today
There's no listing catalyst behind this move, no exchange announcement driving fresh eyes to the token. What actually happened looks more mechanical: price ground down into a multi-month descending triangle on the 4-hour chart, compressing tighter and tighter until one decisive breakout candle snapped it.
Once that triangle broke, short positions that had built up during the downtrend became exposed fast. And this squeeze isn't happening in isolation; it's landing during a broader risk-on stretch across the market, similar to the tone in recent Bitcoin price prediction 2026 coverage.
The chart doesn't lie. When we pulled up the liquidation data alongside the breakout candle, the timing lined up almost perfectly, forcing short covering stacking directly on top of the initial move. That combination, a technical breakout plus a crowded short book, is what tends to produce moves this sharp in this little time.
Technical Analysis: 4-Hour Chart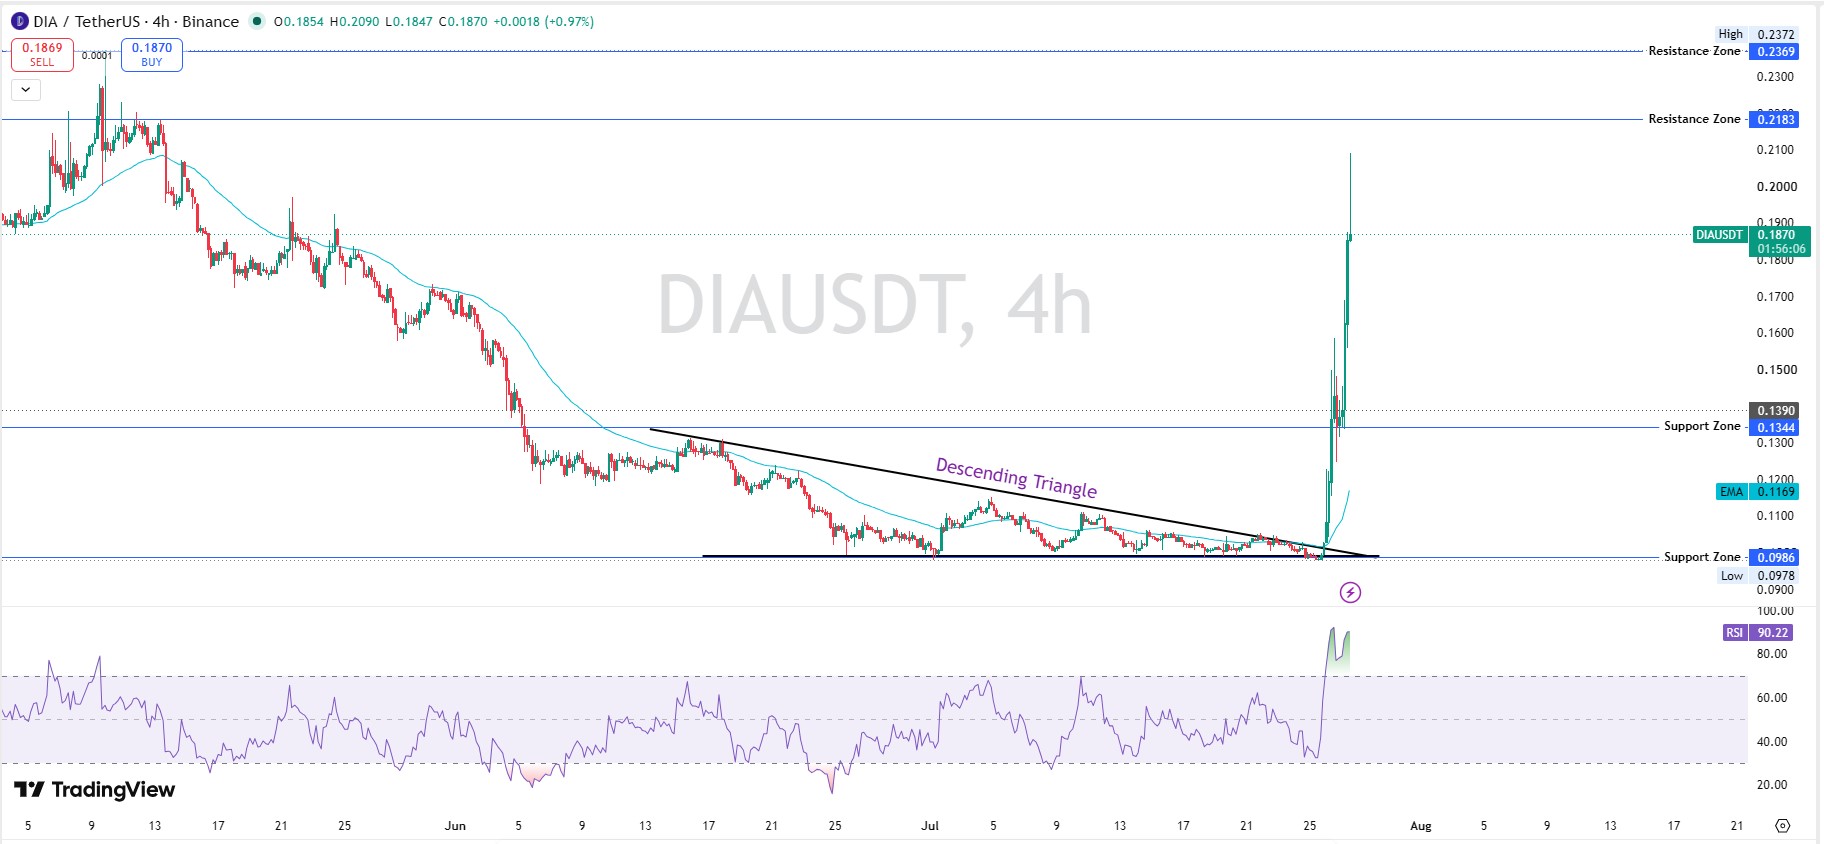
On the 4-hour DIA/USDT chart, price spent weeks grinding inside a descending triangle before a single candle broke it wide open, running from roughly $0.098 up toward a high of $0.209 before settling near $0.187, a move visible on live TradingView chart data. That candle alone represented one of the sharpest single moves DIA has posted all year.
RSI on this timeframe reads 90.22, deep into overbought territory. The EMA sits at $0.1169, well below the current price, confirming the short-term trend has flipped bullish but also flagging just how stretched the move already is.
Resistance sits at $0.2183, with a bigger wall above at $0.2369.
Support underneath sits near $0.1344, backed by a deeper zone at $0.0986.
Support and Resistance Snapshot (4H)
| Level Type | Price |
|---|---|
| Resistance 2 | $0.2369 |
| Resistance 1 | $0.2183 |
| Current Price | $0.1870 |
| Support 1 | $0.1344 |
| Support 2 | $0.0986 |
Technical Analysis: Weekly Chart
Zoom out and the picture calms down a lot. This week's candle opened near $0.1391 and is closing around $0.1782, up 28.2% for the week, breaking out of a falling wedge that had held since last year.
Weekly RSI reads 48.21. Still under the 50 midline.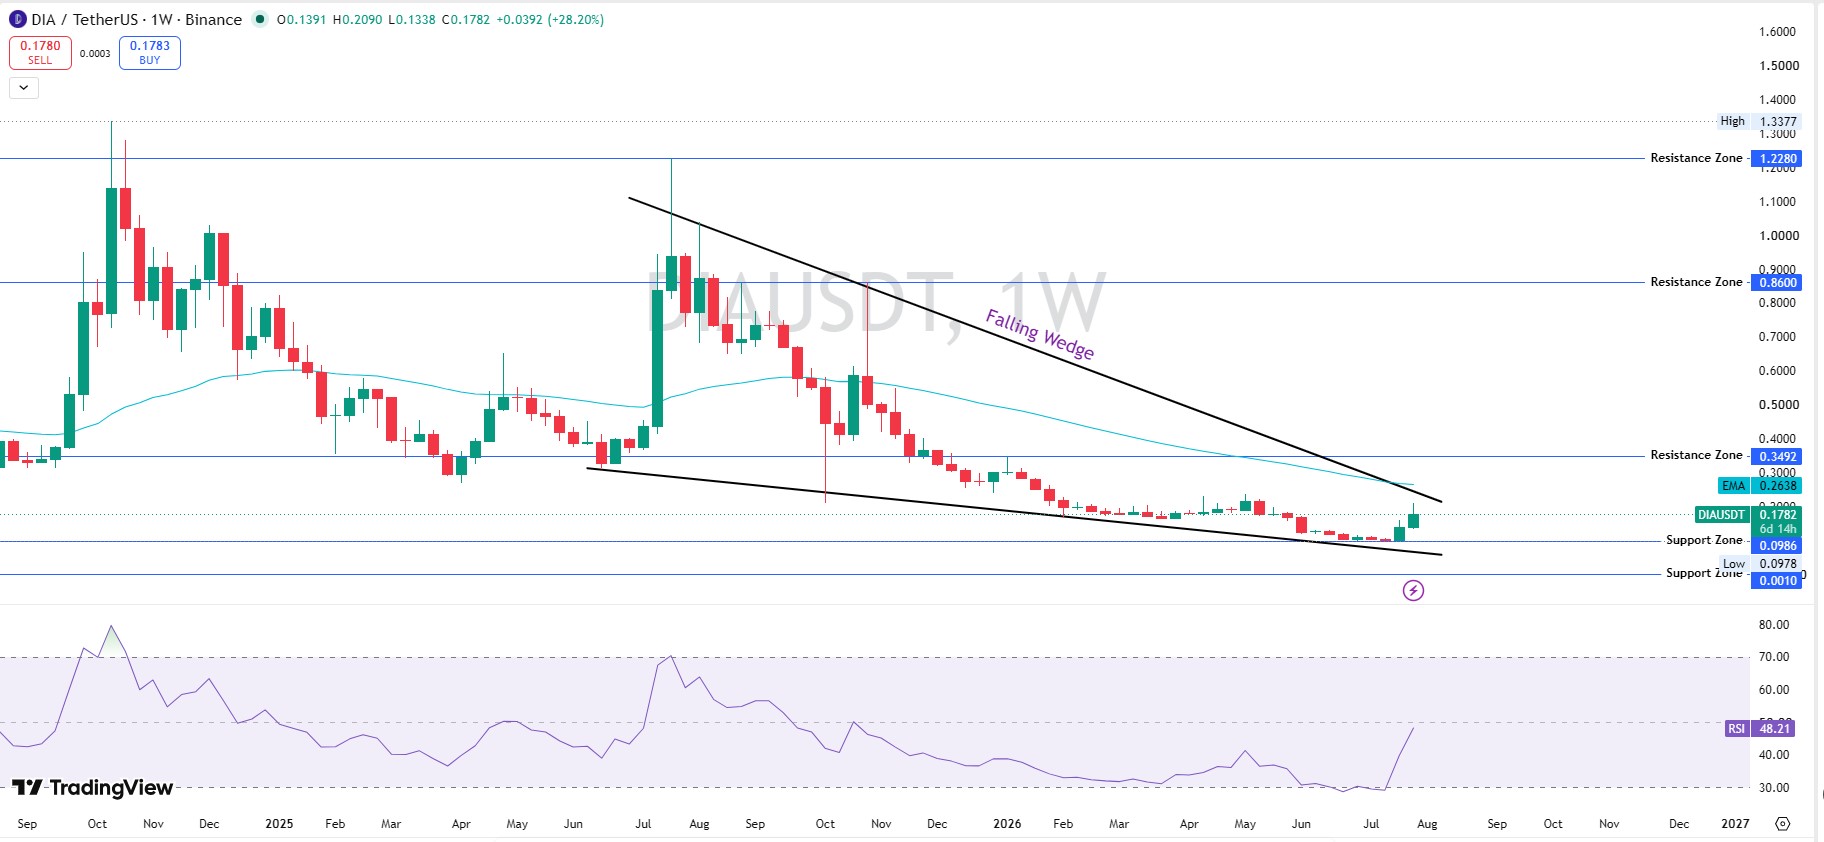
That's the tension in this chart. A huge weekly gain that hasn't even flipped weekly momentum bullish yet by RSI's own measure, a divergence pattern also worth comparing against the current Ethereum price prediction 2026 setup. Which leaves room to run if buyers keep showing up but also signals this move is very fresh and not yet confirmed on a higher timeframe.
Above the price, resistance sits at $0.3492, then much further out near $0.86, and further still near $1.228, levels tied to price action from years back and not something to weigh heavily right now.
Support below sits at $0.0986, with a much deeper structural floor closer to zero.
Support and Resistance Snapshot (Weekly)
| Level Type | Price |
|---|---|
| Resistance | $0.3492 |
| Current Price | $0.1782 |
| Support | $0.0986 |
The Short Squeeze, In Real Time
Liquidation data lines up cleanly with a squeeze narrative, a pattern visible on the Coinglass liquidation tracker.
Over the last hour: $113.99K liquidated. Short positions ate $67.87K of that against $46.11K in long positions.
Over 4 hours: $430.62K total. Shorts took $331.57K, longs just $99.05K.
Zoom to 12 hours: $666.50K, with shorts again dominant at $490.48K.
Full 24 hours: $985.18K total, shorts at $577.28K, longs at $407.90K.
Shorts got hit harder in every single window. That's not random noise; that's forced buying stacking on top of organic demand, and it's exactly what a squeeze looks like when you catch it mid-move.
Tokenomics and Holder Concentration
DIA's contract is an ERC-20 token rated 4.3 out of 5 by CertiK, with holder data visible on Etherscan's token holder page. Total supply reads 168.81M against a 200M max, with circulating supply at 119.67M.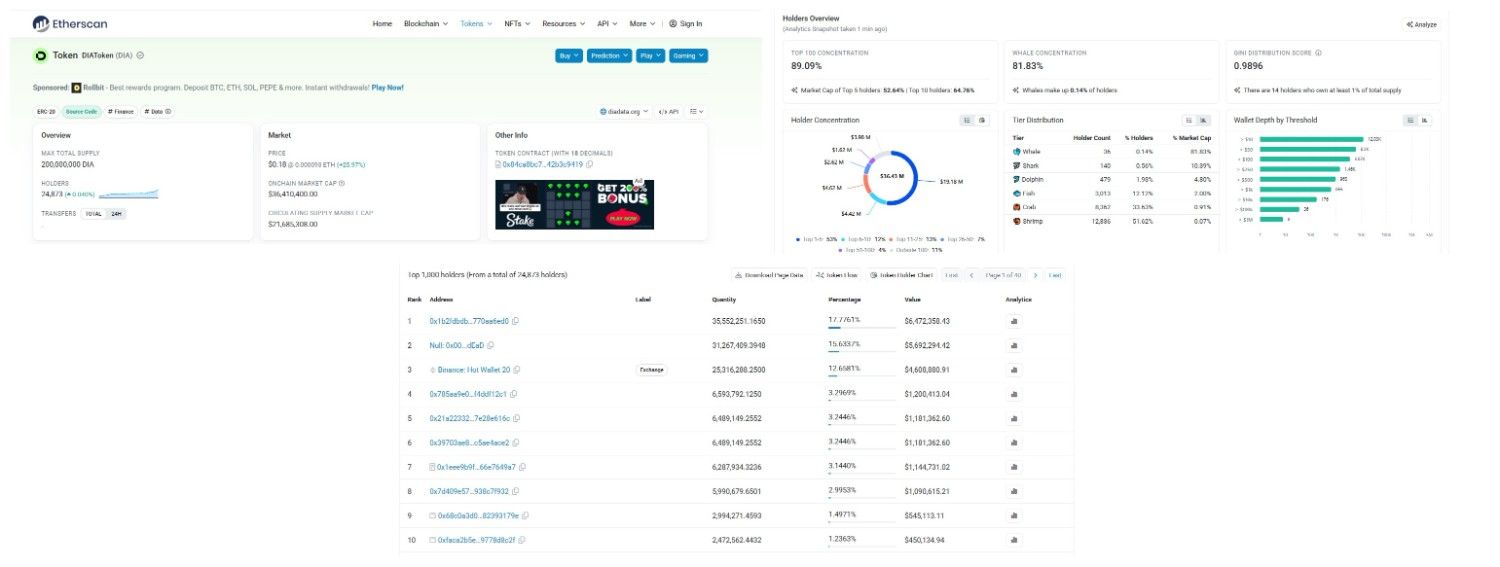
Holder data shows meaningful concentration risk. Top 100 wallets control 89.09% of tracked supply. Whale wallets, just 0.14% of all holders, control 81.83% of market cap. The Gini distribution score sits at 0.9896, close to maximum inequality, and 14 wallets each hold at least 1% of total supply.
But the top holders aren't all speculators sitting on unrealized gains. The single largest address, 17.78% of supply, is unlabeled. The second largest, at 15.63%, is a null or burn address, meaning those tokens are effectively out of circulation for good. Third is a Binance hot wallet at 12.66%, exchange custody rather than a private accumulator, a nuance we've flagged before in our own crypto news coverage of exchange-held supply.
Top Holder Snapshot
| Rank | Holder | % of Supply | Type |
|---|---|---|---|
| 1 | Unlabeled wallet | 17.78% | Unknown |
| 2 | Burn address | 15.63% | Burned supply |
| 3 | Binance Hot Wallet | 12.66% | Exchange |
| 4-10 | Unlabeled wallets | 18.7% combined | Mostly unknown |
Holder Count Caveat: Total holder counts differ by source; CoinMarketCap shows roughly 29.17K holders, while Etherscan lists 24,873. Anyone sizing a position should verify holder data independently before acting on it.
Liquidity and Exchange Volume
Liquidity relative to market cap sits at 1.06%, thin for a token seeing this much attention right now, and futures activity is heavily concentrated on one venue.
Futures Volume by Exchange
| Exchange | 24H Futures Volume |
|---|---|
| Binance | $179.64M |
| Bitget | $16.52M |
| Bitunix | $15.32M |
| Bybit | $12.89M |
| BingX | $11.71M |
| MEXC | $10.73M |
| Gate | $5.54M |
That kind of dominance on one exchange means leveraged positioning, not broad spot demand, is doing most of the heavy lifting behind this rally, a dynamic often flagged alongside broader Bitcoin market conditions when a single venue drives most of the flow.
Bull, Base, and Bear Scenarios
None of this is financial advice. These are scenario-based estimates built from current chart structure, not guarantees.
Bull Case: A daily close above $0.2183 opens a path toward $0.2369 within 7 to 14 days. Probability is roughly 30%, contingent on weekly RSI clearing 50. Invalidation: a daily close back below $0.155.
Base Case: Price consolidates between roughly $0.14 and $0.22 over the next 7 to 30 days as the squeeze cools off. The probability is highest, around 45%. Invalidation: a weekly close outside that range.
Bear Case: Momentum fades and price retraces toward the $0.1344 support zone, with a deeper test of $0.0986 possible within 30 days if broader sentiment turns. The probability is roughly 25%. Invalidation: sustained volume holding above $0.19 for over a week.
Price Forecast Table
| Timeframe | Bear | Base | Bull |
|---|---|---|---|
| 24H | $0.16 | $0.185 | $0.21 |
| 7D | $0.13 | $0.19 | $0.24 |
| 30D | $0.10 | $0.20 | $0.35 |
| Long Term | $0.06 | $0.25 | $0.60 |
These figures aren't predictions of certainty. They're ranges built around the support and resistance levels already visible on the chart, not a promise of what's coming.
Key Risks
Extreme short-term overbought conditions top the list. A 4-hour RSI above 90 leaves very little room before some kind of cooling-off period.
Holder concentration remains high, and while a burn address and an exchange wallet account for a big share of the top holders, the Gini score still points to a thin real float outside those addresses.
Single-exchange futures dominance means this move is currently leverage-driven, not broad spot accumulation. Sector-wide swings, the kind that hit even large-cap names like the recent SpaceX stock pullback, are a reminder that macro mood can override token-specific setups fast.
And a token that just set an all-time low two days ago carries a very short track record at these levels; there isn't much price history to lean on yet.
That's the honest read.
Glossary
RSI: A 0-100 momentum indicator. Above 70 typically signals overbought; below 30 signals oversold.
EMA: A trend-following average that weights recent prices more heavily than older ones.
FDV: What the market cap would be if every token that will ever exist were already circulating.
Gini Score: A measure of distribution inequality, from 0 to 1.
Liquidation: The forced closing of a leveraged position when losses exceed the trader's margin.
Descending Triangle: A chart pattern where price compresses between a flat support line and a falling resistance line.
Invalidation Level: The price point at which a trading thesis is considered wrong and should be abandoned.
Disclaimer: This article is for informational purposes only and does not constitute financial advice. Cryptocurrency markets are highly volatile. Always do your own research and consult a licensed financial advisor before making investment decisions.
Also read:

















