LAB Price Prediction Today: Is A Massive Liquidity Sweep Coming?


LAB price prediction chatter is building around a wide consolidation range that has trapped price for days now, and the way this range finally breaks could set the tone for the next big swing.
The side that gets swept first is the real tell here, not the side that breaks first.
$LAB Price Right Now And Market Snapshot
Metric | Value |
Price | $0.1465 |
24h Change | -4.06% (-$0.003499) |
Market Cap | $45.67M |
Futures Volume (24h) | $172.25M |
Spot Volume (24h) | $7.42M |
Open Interest | $57.69M |
Circulating Supply | 312.09M LAB |
Total Supply | 990.00M LAB |
Max Supply | 1.00B LAB |
The price is taken from the live TradingView chart, with volume, market cap, open interest, and supply figures from LAB data on the CoinGlass LAB market page, as of July 27, 2026, 14:53:15 IST.
Methodology And Data Sources
This $LAB technical analysis uses the 1-hour LAB/USDT chart on Binance via TradingView for price structure, with volume, open interest, and market cap figures from CoinGlass and liquidation flow from CoinGlass's LAB liquidation tracker.
All levels are treated as invalidated only on a confirmed 1-hour candle close beyond the stated trigger, not an intraday wick.
Why Is $LAB Price Down Today
$LAB is down 4.06% over the past day, and the liquidation data below shows longs have been taking the brunt of that move as price grinds inside its range.
This kind of grinding action is common right before a consolidation resolves, since both sides keep getting chopped up until one side finally runs out of resting orders to absorb.
That is exactly the dynamic behind the liquidity sweep setup covered in the technical section below.
$LAB Liquidation Data And Long Short Squeeze
Liquidation flow over the past day leans heavily toward longs getting caught out, which fits a range where buyers have kept trying to call the bottom too early.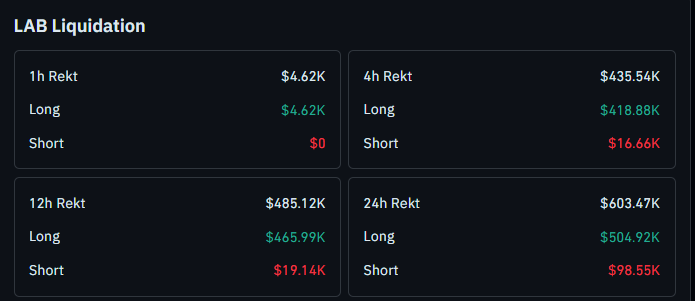
Over the past hour, $4.62K was liquidated, and every bit of it came from longs, with no short liquidations at all.
The 4-hour window shows $435.54K total. with $418.88K in longs against just $16.66K in shorts. Zooming out, the 12-hour window shows $485.12K in total liquidations, with longs taking $465.99K of that versus $19.14K in shorts.
Across the full 24 hours, liquidations reach $603.47K, and longs make up $504.92K of that against $98.55K in shorts.
That consistent long-side skew across every window suggests buyers have kept absorbing the drift lower without much success yet, which is part of why a lower sweep before a reversal is a real possibility here.
The complete breakdown sits on the LAB liquidations dashboard linked above.
$LAB Exchange Volume Distribution
Futures activity in LAB is concentrated across a handful of venues. Binance leads with $52.40M in 24-hour futures volume, followed by OKX at $45.26M and LBank at $26.19M. 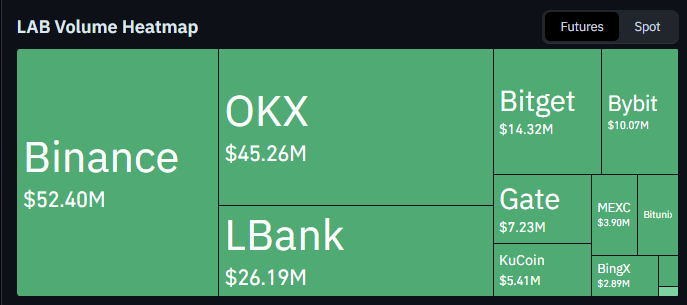
Bitget and Bybit contribute $14.32M and $10.07M, respectively, while Gate, KuCoin, MEXC, Bitunib, and BingX make up the smaller remaining share.
With volume this spread across mid-size exchanges alongside Binance, a real breakout in either direction would likely need participation across more than one venue to hold.
$LAB Holder Concentration And Whale Risk
This $LAB price prediction also comes with a meaningful concentration risk worth flagging. Top 100 wallets control 99.86% of supply, and whale wallets alone, just 0.28% of holders, account for 99.85% of market cap.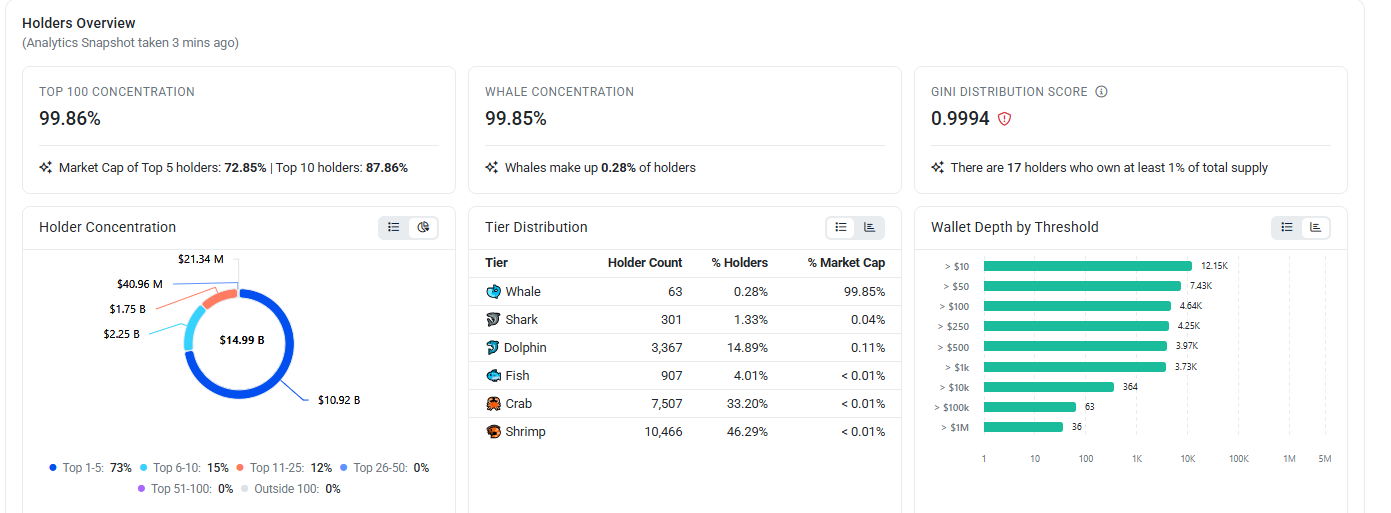
The Gini distribution score sits at 0.9994, and 17 separate holders each own at least 1% of total supply, with the top 5 holders alone controlling 72.85% of market cap and the top 10 controlling 87.86%.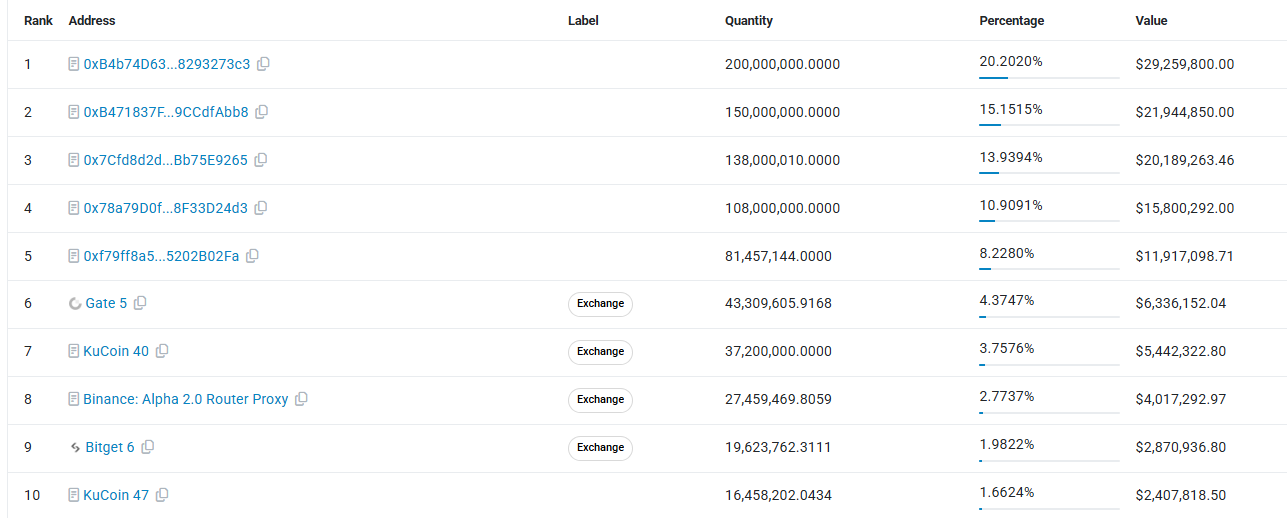
Looking at individual wallets, the single largest wallet holds 20.02% of supply worth roughly $29.26M, and the next four largest non-exchange wallets combined hold close to another 48% of supply.
Several exchange-labeled wallets also appear in the top ten, including Gate, KuCoin, and a Binance router address, which adds another layer of concentrated supply that could move quickly.
Full wallet-level detail is available on LAB's BSCScan holders page.
This level of concentration means a small number of wallets could meaningfully influence which side of the range gets swept first, so it is worth keeping in mind alongside the technical setup below.
Quick Take: LAB is trading near $0.1465 on the 1-hour chart. If LAB first sweeps the lower liquidity near $0.1403 and reverses higher, the first resistance from the current price is $0.1716, with $0.2014 as the next target.
If LAB instead sweeps the upper liquidity near $0.1716 first and rejects instantly, the next levels down are $0.1256 and $0.1124.
This is a short-term read and should be rechecked if the price closes decisively beyond either side of the range.
LAB Technical Analysis
$LAB has been consolidating inside a wide range between $0.1404 and $0.1716 for several days now, and the way this range finally resolves comes down to which side gets its liquidity taken first, not just which side breaks first.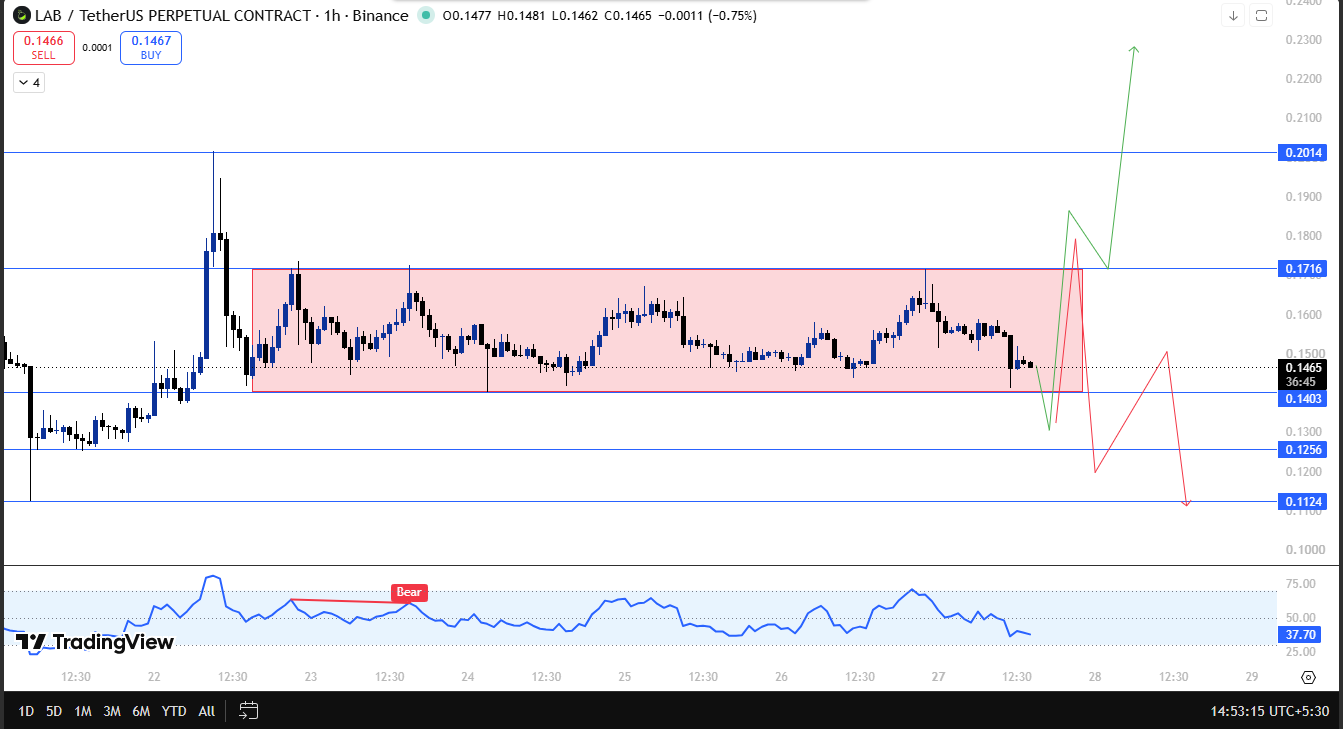
If $LAB dips down and sweeps the resting liquidity sitting below the range near $0.1403, trapping late sellers into a fakeout, and then reverses back up aggressively, that would be the stronger bullish signal.
A sweep of the downside liquidity followed by a reclaim of the range tends to mean the bigger players have already taken the stops they wanted and are now positioned to push higher.
In that case, the first resistance from the current price is $0.1716, with $0.2014 as the next target if momentum carries through, a setup our LAB smart money back coverage also tracks closely.
The other scenario is the opposite. If LAB instead pushes up and takes the liquidity resting above the range near $0.1716, breaking the top of the consolidation, but then rejects almost immediately instead of holding that breakout, that is a classic bull trap.
A sweep of the upside liquidity followed by a quick rejection has a meaningfully higher chance of leading to a move lower, since it usually means the breakout attracted late buyers who are now trapped above the range.
In that case, the next levels down to watch are $0.1256 and then $0.1124 if the selling continues, a pattern flagged in our LAB. Why is LAB crashing liquidity pull analysis?
The core idea here is simple. Whichever side of the range gets its liquidity swept first is the side more likely to reverse, while the side that holds after the sweep is more likely to see continuation.
The RSI on the hourly chart sitting at 37.40 after cooling from an earlier bearish divergence fits a market that has not picked a clear direction yet, which lines up with the range still being unresolved.
LAB Glossary Of Key Trading Terms
Liquidity Sweep: A sharp move through a support or resistance level designed to trigger stop losses and pending orders resting just beyond it, often followed by a reversal.
Fakeout: A false breakout or breakdown that quickly reverses direction, trapping traders who entered on the initial move.
Consolidation Range: A period where price trades sideways between defined support and resistance levels without a clear trend.
RSI (Relative Strength Index): A momentum indicator that measures how fast and how far price has moved, often used to flag overbought or oversold conditions.
Liquidation: What happens when a leveraged trade gets forcibly closed because the trader ran out of margin to keep it open.
Gini Distribution Score: A measure of how unevenly a token's supply is spread across holders, where a score closer to 1 signals extreme concentration.
$LAB Technical Snapshot Table
Indicator | Signal |
Trend | Wide consolidation range, no clear direction confirmed yet |
Structure | Trading near $0.1465, inside the $0.1404 to $0.1716 range |
RSI | At 37.70, cooling off from an earlier bearish divergence |
Liquidations | Longs dominate liquidations across every window over the past 24 hours |
Key Trigger | Lower sweep and reversal favors $0.1716 then $0.2014; upper sweep and rejection favors $0.1256 then $0.1124 |
Broader Risk | Extreme holder concentration, with the top 5 wallets controlling 72. 85% of market cap |
$LAB Support And Resistance Levels To Watch
Type | Level | Note |
Resistance 2 | $0.2014 | Extended target if the lower sweep and reversal plays out |
Resistance 1 | $0.1716 | Top of the range, first target after a downside liquidity sweep |
Current Price | $0.1465 | Trading inside the wide consolidation range |
Support 1 | $0.1403 | Bottom of the range, key liquidity sweep zone |
Support 2 | $0.1256 | The first target is the upper sweep and rejection plays out instead |
Support 3 | $0.1124 | Deeper target if the rejection from above continues |
Risk Reward Table For $LAB Traders
Case | Trigger | Target |
Bull Case | Sweep below $0.1403, followed by a reversal higher | Push toward $0.1716 and then $0.2014 |
Bear Case | Sweep above $0.1716, followed by an instant rejection | Drop toward $0.1256 and then $0.1124 |
Invalidation Level For This LAB Setup
This LAB price prediction hinges on watching which side of the range gets swept first rather than a single fixed invalidation level.
A sweep below $0.1403 that reverses back into the range keeps the bullish path toward $0.1716 and $0.2014 alive.
A sweep above $0.1716 that rejects instantly instead flips the setup bearish, opening $0.1256 and then $0.1124.
A clean, sustained close through either boundary without the opposite side being swept first would call for rechecking the setup entirely, a nuance our LAB whale control buy or stay away update also weighs in on.
Expert View On LAB Price Prediction
Traders following this $LAB price prediction point out that the long-heavy liquidation pattern over the past day, combined with a still-unresolved range, fits a market waiting for one clean stop hunt before committing to direction.
The extreme holder concentration adds another layer worth watching, since a handful of large wallets could easily be behind whichever sweep happens first.
Whether LAB grabs the lower liquidity and reverses or grabs the upper liquidity and rejects will likely set the tone for the next several sessions, a theme our "Why LAB is up today" key target level piece and LAB big bounce recovery setup both track from opposite sides of the range.
Disclaimer: This technical analysis is for educational purposes only and shouldn't be treated as financial or investment advice. Crypto markets are highly volatile.
Also read:

















