GEODNET Price Prediction 2026: $GEOD Eyes All-Time High Breakout Soon?


The project has had a loud week. This GEODNET Price Prediction looks at what is driving the token higher and where the chart could go next after a wave of exchange listing news lit up trading activity.
Direct answer: $GEOD trades near $0.3317, up 54.56% in 24 hours, after Upbit confirmed spot listings and MEXC and KCEX both launched GEOD futures markets. The daily chart shows GEOD reclaiming a rising trendline with RSI at 84.06, an overbought reading that could bring a short-term pullback even inside a bullish structure.
GEODNET Price Prediction: Key Takeaways
-
$GEOD is up over 50% in 24 hours following confirmed listings across Upbit, MEXC, and KCEX.
-
Daily chart shows a 100/200 EMA bullish crossover alongside a reclaimed rising trendline.
-
RSI at 84.06 sits deep in overbought territory, raising the odds of a near-term pullback.
-
A retracement could test $0.22908 and then $0.24878 without breaking the broader uptrend.
-
A continued rally could test $0.34554 and then the all-time high near $0.37991.
What Is GEODNET, And Why Does It Matter For This Rally?
The project operates a decentralized network of ground-based stations that provide high-precision positioning data, the kind of infrastructure used by autonomous vehicles, drones, and mapping applications that need accuracy beyond standard GPS.
That context matters for this rally because the listing news landed on top of an existing project with real infrastructure, rather than a token with no underlying use case.
It does not guarantee the rally holds, but it separates this move from a pure listing-day pump with nothing behind it once the initial volume fades.
Why Is GEODNET's Price Up Today?
The token's move higher lines up directly with a cluster of exchange listing news rather than a single announcement. Upbit confirmed spot trading support for GEOD across the KRW, BTC, and USDT markets, a listing type that typically pulls in fresh retail demand once confirmed.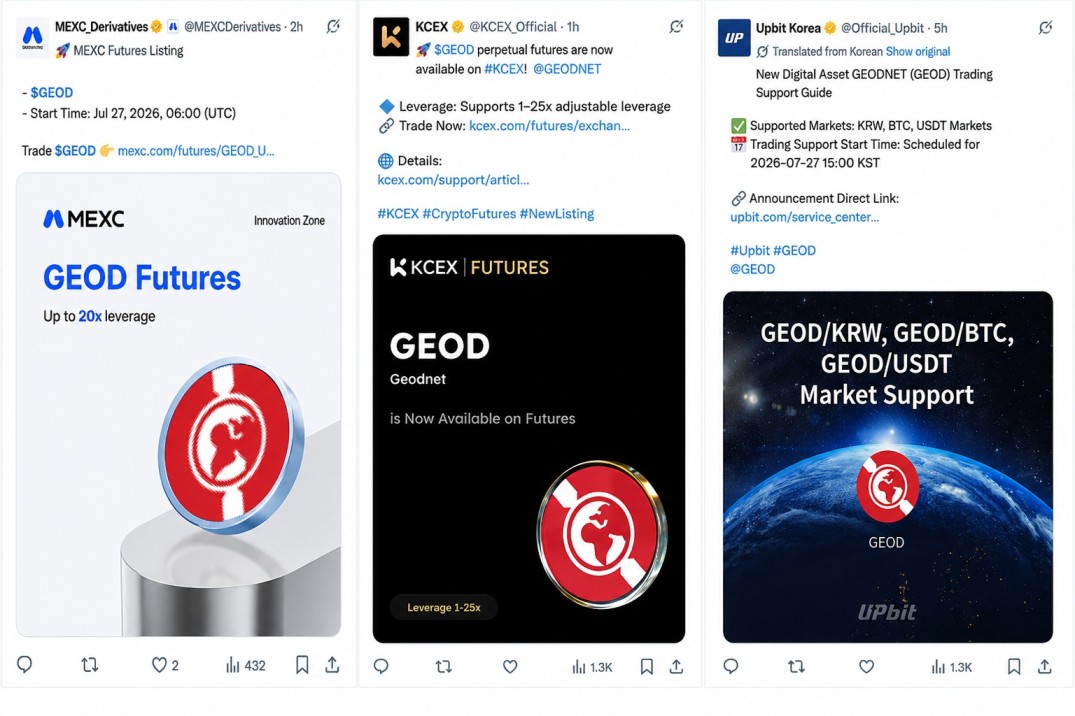
The start time did shift by about two hours on the same day, from 16:00 KST to 18:00 KST, a scheduling adjustment rather than a delay in the listing itself.
MEXC Derivatives also launched GEOD futures on July 27, 2026, at 06:00 UTC, with leverage up to 20x under its Innovation Zone.
KCEX followed with its own GEOD perpetual futures, offering adjustable leverage between 1x and 25x.
How Much Did Trading Volume Increase After The Listings?
Trading volume spiked as much as 1,779% in the immediate window following the listing news, and 24-hour volume is up 4791.77% to roughly $23 million, according to CoinMarketCap.
That kind of multi-exchange listing cluster, spot and futures together, is a classic setup for a buy-the-news rush.
What Do The Latest GEODNET Market Numbers Show?
GEOD (GEODNET) trades at $0.3317 with a $145.98 million market cap, up 55.01% in 24 hours, per CoinMarketCap data as of July 27, 2026.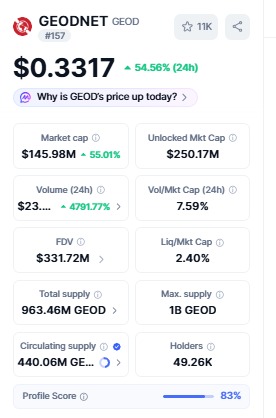
Fully diluted valuation stands at $331.72 million, with a liquidity-to-market-cap ratio of 2.40%.
The circulating supply sits at 440.06 million tokens against a 1 billion max supply, with 963.46 million tokens in total supply and 49.26K holders.
GEODNET All-Time High: How Close Is The Token To A New Peak?
The token's all-time high sits near $0.37991 on the daily chart referenced here.
All-time high figures can differ slightly between data providers depending on which exchange feed and timeframe each platform uses, so treat this figure as a reference point rather than an exact universal number.
At the current price near $0.3317, it sits roughly 12.7% below that reference high, a notably small gap compared to most tokens recovering from a broader downtrend.
GEODNET Price Prediction: What Does The Daily Chart Show?
On the daily TradingView chart, $GEOD has respected a rising trendline since late April, tapping it multiple times and bouncing higher on each retest, a pattern that reflects a well-established uptrend rather than a single lucky bounce.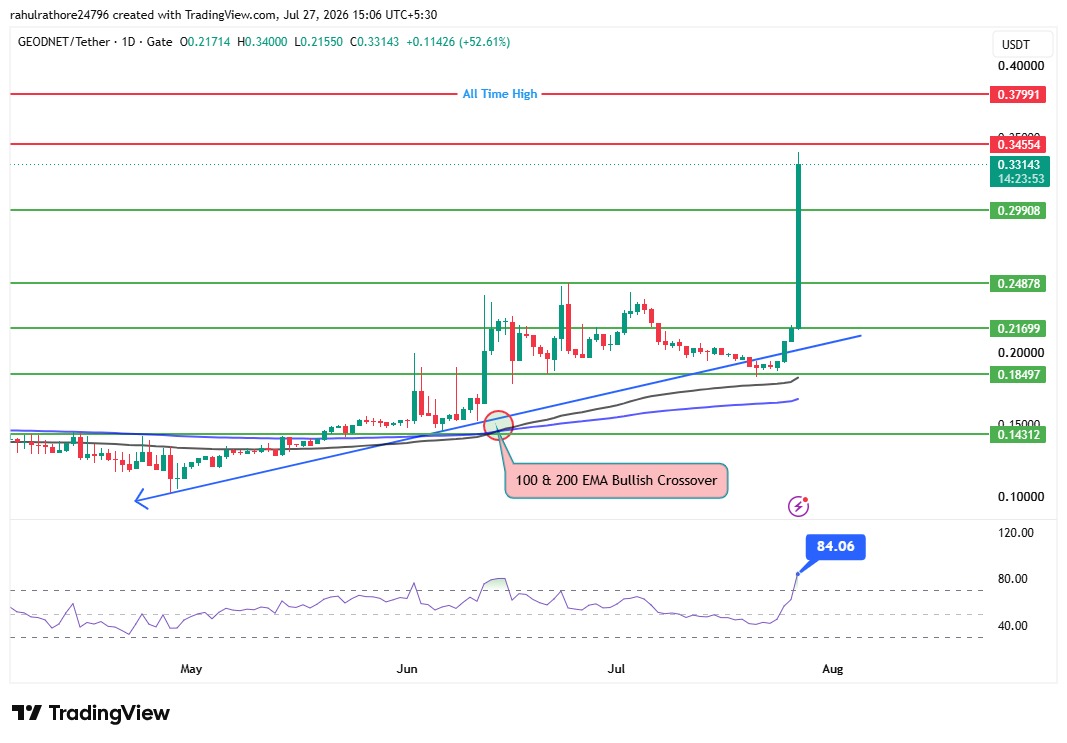
On July 20, the price broke below that trendline, which briefly looked like the uptrend was ending.
Instead, the token found support at $0.18497 and reversed sharply, turning what looked like a breakdown into a fakeout, followed by the current rally.
Alongside that reversal, the 100 and 200 EMA lines completed a bullish crossover, a signal that often confirms a shift from a longer consolidation phase into a sustained uptrend.
This combination of a reclaimed trendline and a moving average crossover is generally read by chart analysts as one of the stronger confirmations available on a daily timeframe.
What Is RSI Signaling On The Daily Chart Right Now?
Daily RSI reads 84.06, deep into overbought territory. That does not automatically mean a reversal is coming, but it does raise the odds of a short-term retracement before the next leg higher.
The broader bullish structure stays intact while price holds above the 100 and 200 EMA lines, even if RSI cools off from these extended levels.
What Happens If The Token Pulls Back Or Keeps Rallying?
If the token retraces from current levels, $0.22908 is the first support to watch, based on prior chart structure in that zone.
A deeper pullback could test $0.24878 next, still well within the broader uptrend while the EMA crossover holds.
If the rally instead continues, $0.34554 stands as the next resistance based on recent price structure, with the $0.37991 all-time high reference level as the target beyond that if momentum extends that far.
GEODNET Price Prediction: Bull, Base, And Bear Case
| Scenario | Target Range | Key Assumption | Invalidation Level |
| Bull Case | $0.34554 – $0.37991 | Price holds above the reclaimed trendline and EMA crossover with continued listing-driven volume | Daily close back below $0.28497 |
| Base Case | $0.22908 – $0.28497 | RSI cools from overbought while price consolidates above the EMA crossover | Break of $0.22908 with volume |
| Bear Case | $0.18497 – $0.22908 | Momentum fades and price retests the July 20 breakout zone | Daily close back below $0.18497 |
Methodology note: Targets are drawn from prior swing highs and lows on the daily chart, the location of the reclaimed trendline, and the EMA crossover level. Invalidation levels mark where each scenario's core assumption would break down. These are technical projections, not guaranteed outcomes.
GEODNET (GEOD) Tokenomics Overview
| Metric | Value |
| Market Cap | $145.98M |
| Fully Diluted Valuation | $331.72M |
| Circulating Supply | 440.06M |
| Total Supply | 963.46M |
| Max Supply | 1B |
| Holders | 49.26K |
| All-Time High (reference) | $0.37991 |
Expert Opinion: Analyst Take On This GEODNET Price Prediction
CoinGabbar analysts note that $GEOD's rally is backed by a genuine catalyst, confirmed spot and futures listings across three exchanges in the same window, rather than speculation alone.
The EMA crossover and trendline reclaim both support the idea that this is a structural shift, not just a listing-day spike.
At the same time, RSI at 84.06 is a real caution flag. Listing-driven rallies often cool off once early volume fades, so a retracement toward the EMA-supported zone would not contradict the broader bullish setup already in place.
Quick Glossary For GEODNET Price Terms
RSI (Relative Strength Index): A momentum indicator from 0-100 that flags overbought conditions near 70 and above and oversold conditions near 30 and below.
-
EMA Crossover: When a shorter exponential moving average crosses above or below a longer one, often used to confirm a trend change.
-
Trendline: A line connecting a series of price highs or lows that shows the direction and strength of a trend.
-
Fakeout: A brief break of a key level that quickly reverses, trapping traders who acted on the initial move.
-
Fully Diluted Valuation (FDV): A token's market cap if its entire max supply were in circulation at the current price.
YMYL Disclaimer: This article is for informational purposes only and should not be considered financial, investment, or trading advice. Cryptocurrency markets, including this token, are highly volatile and speculative. Predictions are based on technical analysis and public data as of July 27, 2026, and may not reflect future performance. Readers should conduct their own research and consult a licensed financial advisor before making any investment decisions.
Also read:

















