Can $DOGE Reach $4.2 in 2027? Must Watch: Dogecoin Price Prediction


A viral post is going around claiming DOGE could hit $4.2 within a couple of years, and it's got the community buzzing again.
This Dogecoin Price Prediction looks past the hype and at what the actual chart is showing: DOGE is consolidating tightly after a long slide, right at a level that's decided big moves before.
Momentum could turn here, and DOGE holders don't want to miss it.
Market data was checked on August 17, 2026, at 13:42 IST.
Dogecoin Price Prediction Today: Market Overview
Metric | Value |
Price | $0.07017 |
24h Change | +0.42% |
Market Cap | $10.91B |
24h Volume | $257.0M |
Vol/Mkt Cap (24h) | 2.35% |
FDV | $10.91B |
Total Supply | 155.52B $DOGE |
Max Supply | ∞ (uncapped) |
Circulating Supply | 155.52B $DOGE |
Source: Data from CoinMarketCap as of August 17, 2026, at 13:42 IST. Figures may vary slightly across other tracking websites.
Dogecoin News: DOGE and the Viral "$4.2 by 2027" Claim
A post from the account Dogecoin Rise has been circulating, styled like a breaking news graphic and claiming DOGE will hit $4.2 in 2027. 
Source: Data From X
Note: This is a social media post, not a verified forecast, and CoinGabbar could not independently verify the claim or any method behind it. A move to $4.2 would mean DOGE gaining roughly 60 times its current price, a figure with no documented basis in the post itself.
It's worth treating this as community hype and meme energy rather than a real price target, though posts like this often do drive short-term buzz and trading interest around a coin.
DOGE Price Prediction Chart: Technical Analysis
Pair: DOGE/USDT · Market: Spot (Crypto) · Exchange: KuCoin · Timeframe: 1D · Source: TradingView · Timestamp: August 17, 2026, 13:42 UTC+5:30
DOGE is trading at $0.07017 after a long slide from its May highs. The chart shows a falling trendline that has squeezed the price lower since May.
Since early August, DOGE has stopped falling and started consolidating in a tight range between $0.06917 and $0.07337.
A falling trendline is often watched for a breakout to the upside once price clears the top of the range, and the chart marks a projected level near $0.10115, about 37% above current price, if that breakout plays out and continues.
The EMA (Exponential Moving Average, a line that tracks the average price over time, weighted toward recent candles) lines are close together just above price, with the EMA 20 at $0.07035 and the EMA 50 at $0.07346.
The RSI (Relative Strength Index, a momentum indicator that measures how fast and how far price has moved) is at 47.04, sitting right near the midline, showing no strong momentum in either direction yet.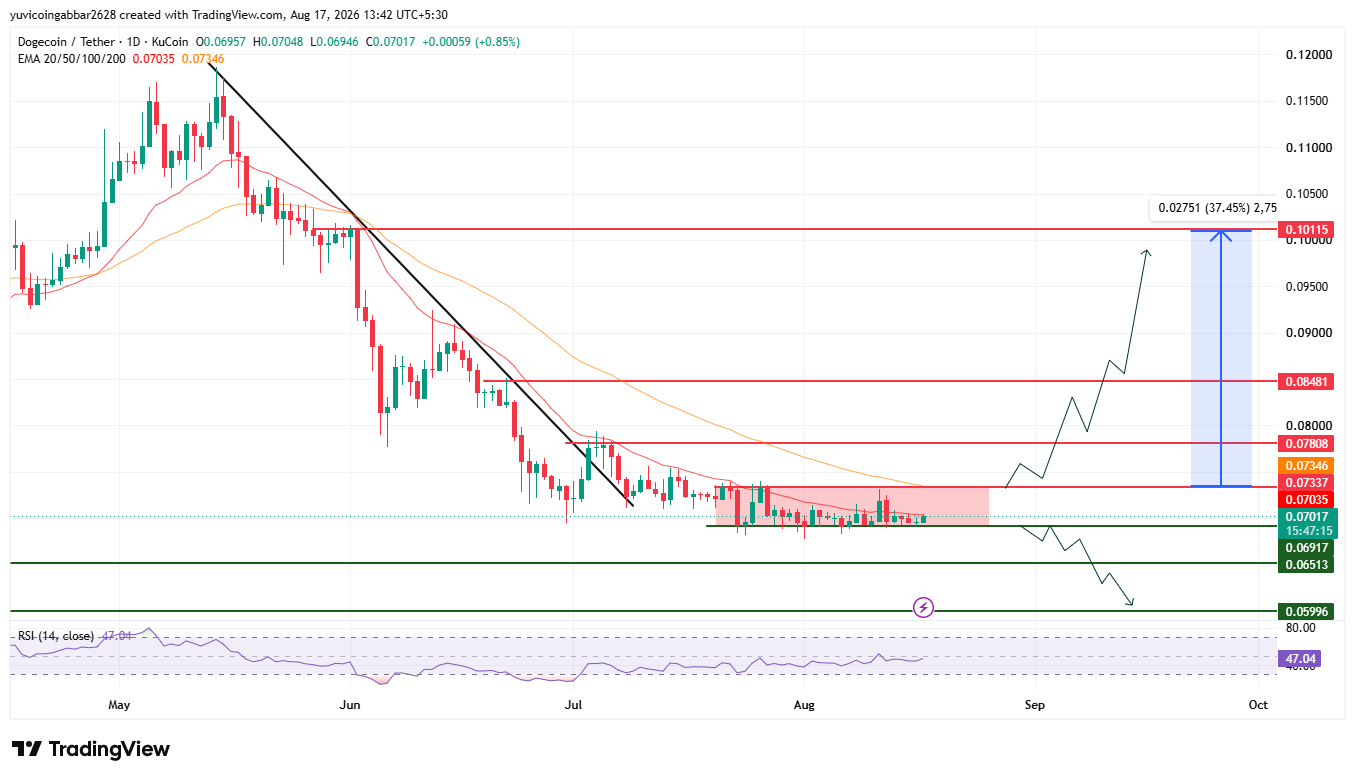
Support and Resistance Levels
Level Type | Price |
Resistance 4 | $0.10115 |
Resistance 3 | $0.08481 |
Resistance 2 | $0.07808 |
Resistance 1 (consolidation top) | $0.07337 |
Immediate Price Reference | $0.07017 |
First Support (consolidation bottom) | $0.06917 |
Deeper Support | $0.06513 |
Structural Floor | $0.05996 |
EMA Levels
EMA | Price |
EMA 20 | $0.07035 |
EMA 50 | $0.07346 |
RSI (14) | 47.04 |
Dogecoin Forecast: Bull Case vs. Bear Case
$DOGE price target 2026 Bull case: The tight consolidation above $0.06917 both suggest selling pressure is decreasing.
A confirmed break above $0.07337 would clear the current range and open the path toward $0.07808, with $0.08481 as the next resistance after that.
$DOGE price target 2026 Bear case: Consolidations don't always break upward, and a failure to clear $0.07337 followed by a close below $0.06917 would suggest sellers are still in control.
Losing that level would expose $0.06513 and then the structural floor at $0.05996.
$DOGE Price Scenarios: Triggers and Invalidation
Scenario | Trigger | Likely Outcome | Invalidation Point |
Trendline reclaim | DOGE closes above $0.07337 | Consolidation breakout, move toward $0.07808 | Rejection at $0.07337 |
Channel hold | Price stays above $0.06917 | Consolidation continues inside the range. | Close below $0.06917 |
Channel breakdown | Price closes below $0.06917 | Drop toward $0.06513 and the $0.05996 floor. | Reclaim of $0.06917 |
$DOGE Price Target: Can $DOGE Reach $0.10115?
$0.10115 is the highest actual resistance level marked on the chart.
Getting there would take a break above $0.07337 at the top of the current range, then a push through $0.07808 and clear the $0.08481 level.
It's a multi-step move, not a single breakout candle, and would need the price to play out the way it's typically expected to.
What Could Invalidate the Bullish Setup?
A rejection at $0.07337 followed by a close back below the consolidation range at $0.06917 would put the breakout in question.
A further break below $0.06513 and the structural floor at $0.05996 would suggest the downtrend still has room to continue.
Dogecoin Price Prediction: Expert View
According to CoinGabbar analysts, DOGE's tight range has been carved out since the early August point to selling pressure cooling off, though the RSI sitting right at the midline shows momentum hasn't clearly picked a side yet.
The $0.07337 level at the top of the current range is the one to watch: clearing it would fit the classic range-breakout setup, while another rejection there keeps DOGE stuck in this range a while longer.
Worth noting that the viral $4.2 claim making the rounds is meme hype, not a real target, and shouldn't be confused with what the actual chart is showing.
Disclaimer: This piece is for informational purposes only and isn't financial advice. The levels and scenarios above are based on technical chart analysis and publicly available data at the time of writing, and crypto markets can move sharply within hours, so past patterns don't guarantee future outcomes. It's worth doing independent research and considering your own risk tolerance before acting on any of the levels discussed here.
Also read:













.webp)








