BNB Price Prediction: Can BNB Bounce Back Above $612?


BNB price prediction traders have had a smooth ride for close to a month now, watching Binance Coin climb in an orderly fashion, using a rising trendline as its floor while forming a fresh higher high at every retest along the way.
That streak just hit a snag. Price has broken below the trendline and closed a candle under it for the first time since this run began, and the next few candles will likely decide whether this was a brief shakeout or the start of something bigger.
The levels here come from the 4-hour BNB perpetual chart and reflect a short-term view.
If the price moves decisively outside this range, the setup should be revisited rather than assumed to still hold.
Binance Coin Price Right Now
Metric | Value |
Price | $605.33 (CoinGlass: $605.32, -0.1%) |
24h Futures Volume | $387.82M |
24h Spot Volume | $70.54M |
Market Cap | $80.42B |
Open Interest | $986.91M |
Circulating Supply | 133.16M |
Total Supply | 133.16M |
Max Supply | 133.16M |
Open interest sits just under $1 billion, the total value of $BNB futures contracts still open across the market right now.
A figure this size, right as the price tests its broken trendline, means leveraged positioning could add real weight to whichever direction the next move takes.
Chart source: TradingView, BNB/USDT Perpetual Contract, Binance, 4-hour timeframe, captured Aug 17, 2026, around 1:50 PM IST (08:20 AM UTC).
Methodology and data sources: Price and volume data from CoinGlass, liquidation figures from CoinGlass, and network activity data from BscScan's BNB Smart Chain dashboard.
BNB Chain Network Activity Snapshot
Fresh on-chain data adds useful context to this Binance Coin forecast beyond the price chart alone.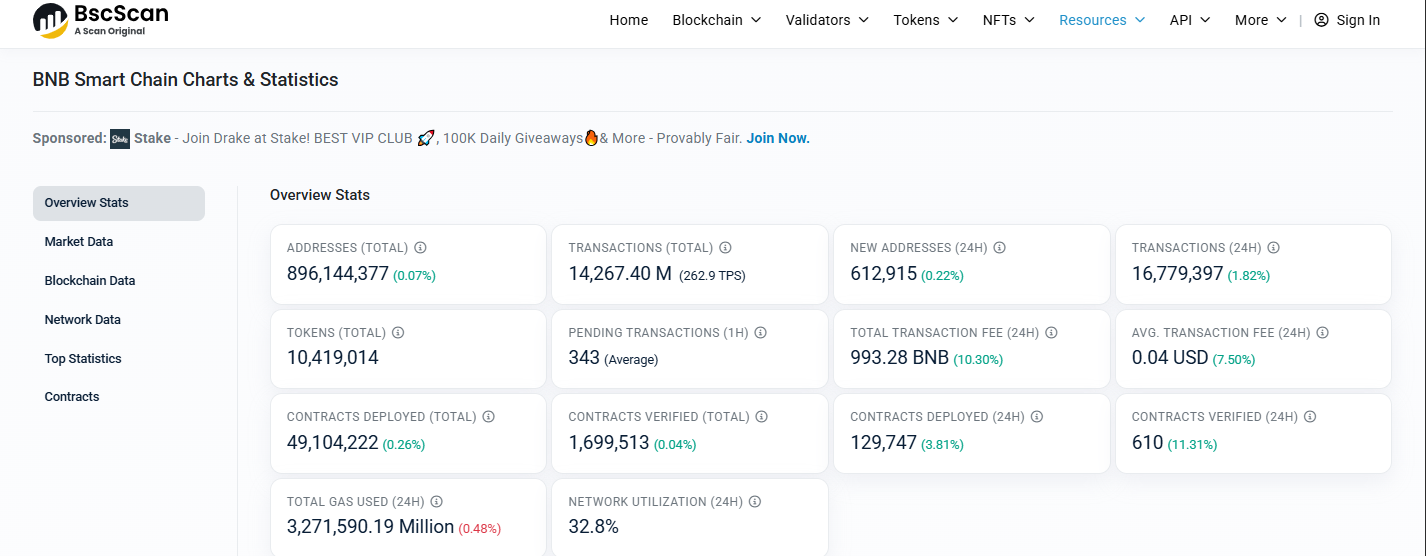
BNB Chain now counts 896,144,377 total addresses, up 0.07%, with 612,915 new addresses added in the past 24 hours, a rise of 0.22%.
Total transactions on the network have crossed 14,267.40 million, running at an average of 262.9 transactions per second, and the 24-hour transaction count grew 1.82% to 16,779,397.
Total transaction fees paid over the last 24 hours reached 993.28 BNB, up 10.30%, while the average fee per transaction still climbed 7.50% to $0.04.
On the development side, 129,747 new contracts were deployed in the past 24 hours out of 49,104,222 total, and network utilization stands at 32.8%.
Steady growth in new addresses alongside a modest rise in fees points to a network handling normal activity without any sign of congestion, a reasonably healthy backdrop for this BNB technical analysis.
Source: BscScan network dashboard, captured Aug 17, 2026.
BNB News: CZ to Abandon Public Wallet After Meme Coin Flood
Binance co-founder Changpeng Zhao has announced he's stepping away from a public wallet he had been using after it got flooded with unsolicited meme coins. 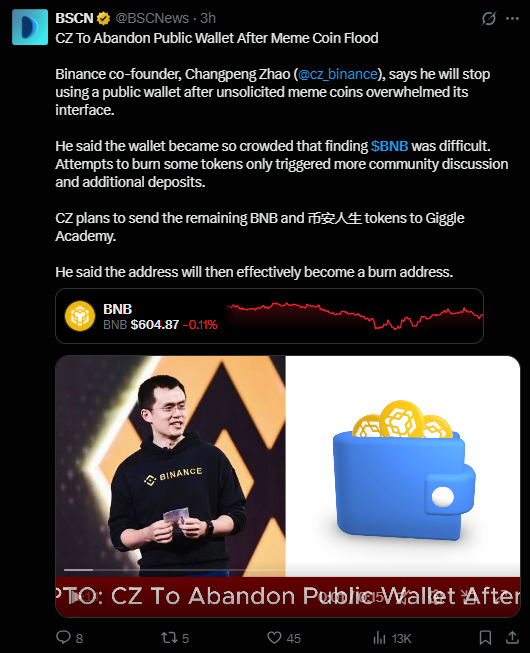
CZ explained that the wallet became so cluttered that locating actual $BNB holdings turned difficult, and even attempts to burn unwanted tokens backfired, triggering more community chatter and fresh deposits instead of cleaning things up.
Going forward, he plans to send the remaining $BNB and 币安人生 tokens to Giggle Academy, after which the address will effectively turn into a burn wallet.
Source: BSCNews on X, posted 3 hours before capture.
BNB Liquidation Data Today
Liquidation flow is leaning toward shorts across every timeframe, even with the trendline break, which fits a market where the drop so far has been more of a squeeze than a sharp reversal.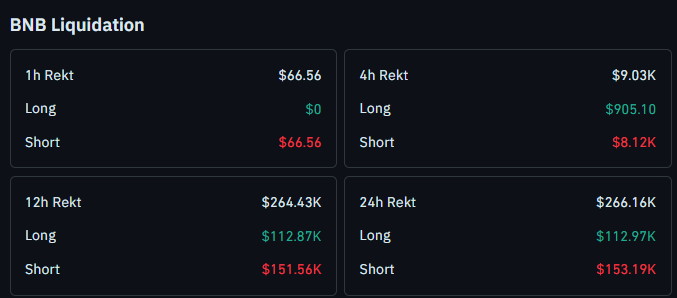
The last hour saw $66.56 in total liquidations, all of it from short positions, with longs at zero.
The 4-hour window shows $9.03K in total liquidations, made up of $905.10 in longs and $8.12K in shorts.
Zooming out to 12 hours, total liquidations reach $264.43K, split between $112.87K in longs and $151.56K in shorts.
Across the full 24 hours, liquidations hit $266.16K, with $112.97K from longs and $153.19K from shorts.
Source: CoinGlass, BNB liquidation data, captured Aug 17, 2026.
BNB Trend and Momentum: Key Takeaways
Coin trades at $605.33, just below the trendline; it broke down after weeks of higher highs
This is the first 4-hour candle to close below the ascending trendline since the rally began around July 24
A close back above $612.42 on strong volume would suggest the breakdown has failed
Resistance above sits at $633.19, then $652.21, with $687.26 marked as the extended strong resistance
A close below $597.50 would confirm the breakdown, with $585.72 as the next support
Short liquidations continue to outweigh longs across every timeframe, suggesting this move down has trapped short-term shorts as much as it has hurt longs
Leveraged positions around any of these zones carry genuine liquidation risk, as the numbers above show. These levels describe a chart-based framework, not a guaranteed outcome.
BNB Price Outlook: 4-Hour Chart Analysis
Since around July 24, BNB has climbed steadily along a strong ascending trendline, and every retest of that line produced a fresh higher high.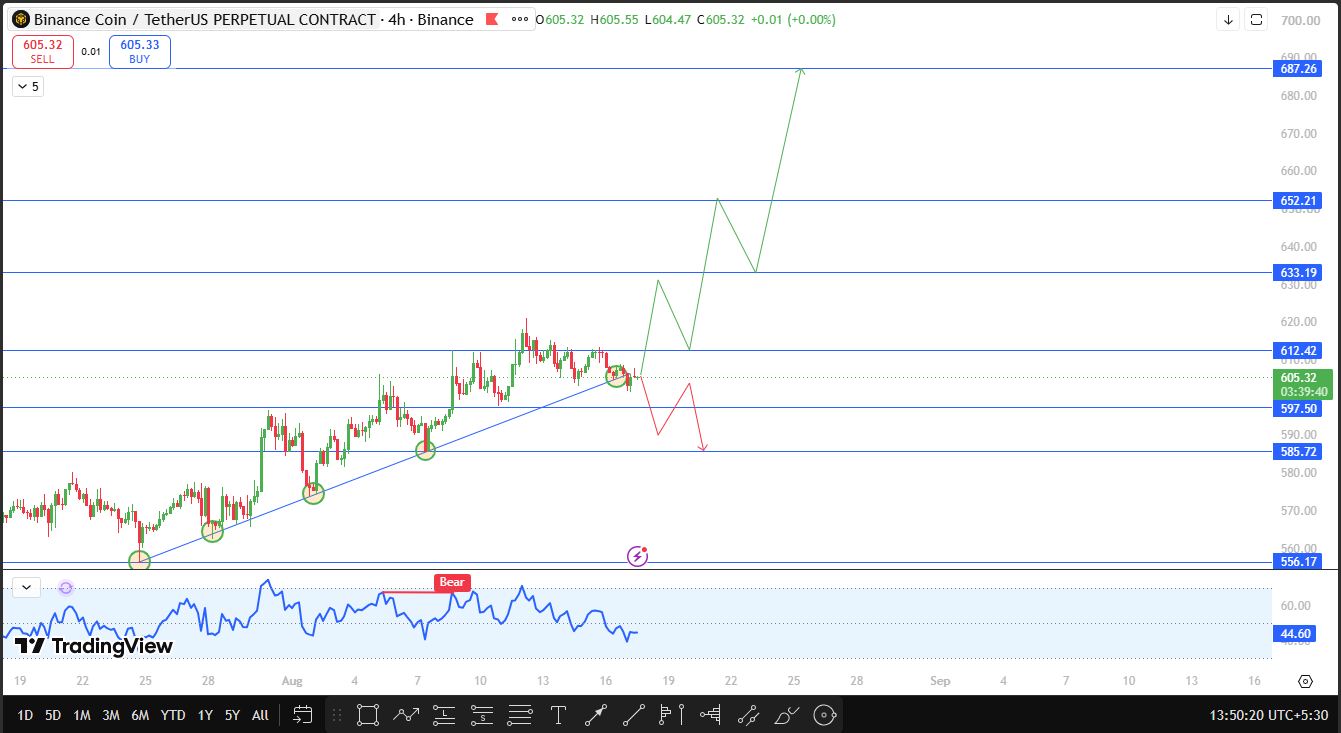
That structure just broke. Price has closed a 4-hour candle below the trendline for the first time in this entire move, marking a real shift from what had been a clean uptrend.
The immediate question is whether this breakdown holds or gets rejected quickly.
A close back above $612.42, backed by a strong volume candle, would suggest sellers failed to follow through and the trendline breakdown was a false move.
In that scenario, resistance comes into play at $633.19, roughly 4.60% above CMP, followed by $652.21, near 7.75% higher.
A sustained push beyond that range would put $687.26 in focus, close to 13.54% above CMP, marked as the extended strong resistance for this setup.
If instead the price closes below $597.50, about 1.29% under CMP, the breakdown gains confirmation, and the uptrend structure that carried BNB for weeks would officially be broken.
From there, $585.72 becomes the next support to watch, roughly 3.24% lower, and would be the first real test of how much downside follows.
BNB Technical Outlook Snapshot
Indicator | Signal |
Price Structure | Ascending trendline broken, first close below it since the rally began |
Momentum Oscillator (RSI) | Reading near 44.60, with a bear tag visible on recent candles |
Immediate Bias | Cautious to bearish unless price reclaims $612.42 |
Bullish Trigger | 4H close above $612.42 with strong volume |
Bearish Trigger | 4H close below $597.50 |
Invalidation | 4H close below $597.50 |
Support and Resistance Levels to Watch
Type | Level | Note | % From CMP |
Resistance | $687.26 | Extended strong resistance | +13.54% |
Resistance | $652.21 | Second resistance target | +7.75% |
Resistance | $633.19 | First resistance target | +4.60% |
Reclaim Level | $612.42 | Close above here on strong volume fails the breakdown. | +1.17% |
Current Price | $605.33 | Live CMP | 0% |
Support | $597.50 | Confirms trendline breakdown | -1.29% |
Support | $585.72 | Next support if breakdown confirms | -3.24% |
Risk-Reward Table
Case | Trigger | Target |
Breakdown fails | 4H close above $612.42 with strong volume | $633.19, then $652.21 |
Extended bullish | Sustained move above $652.21 | $687.26 |
Bearish confirmation | 4H close below $597.50 | $585.72 |
Invalidation Level
This BNB price forecast treats a 4-hour close below $597.50 as confirmation of the trendline breakdown, with $585.72 as the level that would need to hold to prevent further downside.
A close back above $612.42 on strong volume, meanwhile, would be the clearest sign that this breakdown was premature and the broader uptrend is still intact.
Trading around any of these zones on leverage carries genuine risk.
A quick move in either direction before the setup fully confirms is possible, and the liquidation data above shows how fast overleveraged positions have already been getting cleared out.
How Bitcoin Could Influence Binance coin
Bitcoin sentiment remains a relevant factor here, even with BNB's own trendline break driving the current story.
A stable or rising Bitcoin would likely help price reclaim $612.42 and work toward $633.19 and $652.21 with less resistance.
A risk-off shift in Bitcoin, on the other hand, would make a confirmed close below $597.50 more likely, even with BNB Chain's network activity holding up reasonably well right now.
Planned Update
This prediction will be revisited if BNB closes a 4-hour candle beyond either $612.42 or $597.50, or if no clear resolution happens within the next 24 to 48 hours.
A meaningful shift in $BNB Chain network activity or a large liquidation event would also be reason enough to update this outlook sooner.
Glossary
Ascending Trendline: A rising support line connecting a series of higher lows, used to track an uptrend's structure
Open Interest: The total value of outstanding futures or perpetual contracts that remain open and unsettled
Liquidation: The forced closing of a leveraged position by an exchange once losses erode a trader's required margin
Network Utilization: A measure of how much of a blockchain's available processing capacity is currently being used
Invalidation Level: The price point at which a technical outlook is no longer considered valid, requiring the setup to be reassessed
CoinGabbar's Technical Analyst View
Bull Case: Price reclaims $612.42 on strong volume, showing the trendline break was a shakeout rather than a reversal, and works toward $633.19 and $652.21 before extending to $687.26 on continued strength.
Base Case: Price stays stuck between $597.50 and $612.42 without a decisive close on either side, resulting in a choppy stretch as the market decides whether the breakdown is real.
Bear Case: Price closes below $597.50, confirming the trendline breakdown, and slides toward $585.72, putting the broader uptrend that has held since late July at real risk.
Disclaimer
This price prediction is prepared for informational purposes only and should not be treated as financial or investment advice. Cryptocurrency markets, including BNB, are highly volatile, and leveraged trading carries significant risk of loss, including liquidation, as shown in the data above. Readers should conduct their own research and consult a qualified financial advisor before making any investment decisions. CoinGabbar and the analyst preparing this piece do not hold a position at the time of publication.













.webp)








