Dogecoin Price Prediction: $DOGE Breakout After 87-Day Kumo Cloud Trap


This Dogecoin price prediction comes at a pivotal moment for the original meme coin. Even years after its 2013 launch as a joke, DOGE still commands one of the largest and most active communities in crypto, and it just pushed out of a multi-month technical trap.
Today $DOGE trades at $0.07159, up 2.1% over the past day, as the token now tests whether it can hold that breakout move.
With a circulating supply of 155.459 billion tokens against a total supply of 171.171B and no max supply cap, DOGE relies on massive scale and network activity rather than scarcity to drive its price story.
This article looks at where $DOGE stands today against that backdrop, not just where the charts point next.
$DOGE Live Market Data
$DOGE is currently trading at $0.07159, up 2.1% on the day. The 24-hour range has stayed fairly wide, between $0.06993 and $0.07289.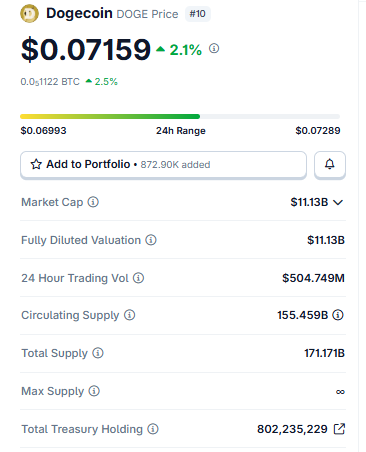
Source: $DOGE market data taken from live exchange feeds, as of Aug 12, 2026. Figures may vary slightly across other tracking websites.
Market cap stands near $11.13B, matching its fully diluted valuation of $11.13B given a total supply of 171.171B tokens against 155.459B circulating. Total treasury holdings sit at 802,235,229 DOGE.
Trading volume over the last 24 hours came in at $504.749M, strong for a token this size.
Liquidation Data of Dogecoin
Leverage traders got hit on both sides over the past day, though shorts absorbed the bigger share of the damage.
Total liquidations hit $2.48M over 24 hours, with shorts taking $1.51M against $964.04K in longs.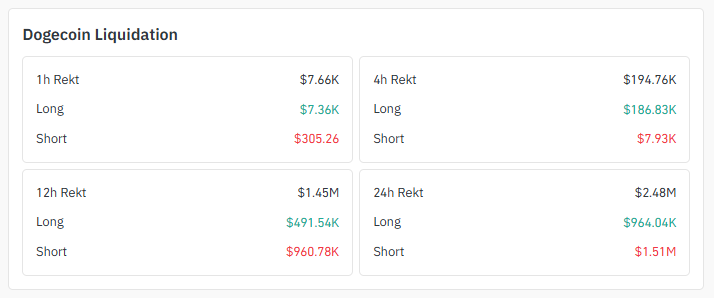
Source: liquidation data taken from Coinglass.
The 12-hour window tells a similar story, with $960.78K in short liquidations against $491.54K on the long side, suggesting short sellers got caught off guard as price pushed higher.
But the momentum has flipped more recently: over the last 4 hours, longs took the bigger hit at $186.83K versus just $7.93K in shorts, a sign of some profit-taking or hesitation right at the breakout zone.
Exchange Volume of $DOGE
Binance leads Dogecoin trading volume right now at $411.04M, followed by OKX at $254.57M and MEXC at $117.07M.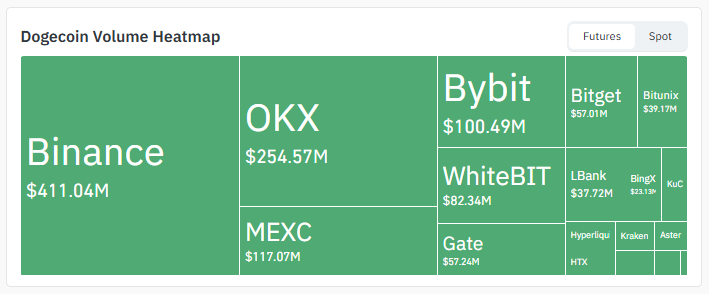
Source: Volume heatmap data taken from Coinglass.
Bybit adds $100.49M, while WhiteBIT, Gate, Bitget, Bitunix, LBank, and BingX contribute smaller but steady volume across the board.
Spread across this many venues, liquidity looks deep enough to support a sustained breakout move without major slippage.
Key Takeaways
-
DOGE is trading around $0.07159, up 2.1% in the last 24 hours.
-
On the 1H chart, the price just broke above resistance and is retesting the breakout zone; a hold above it could open the door toward $0.07451.
-
The 4H chart shows price inside an ascending channel, with a breakout above $0.07370, leading to a level of $0.07564.
-
Shorts took the bigger liquidation hit over 24 hours at $1.51M, but longs have absorbed most of the pressure in the most recent 4-hour window.
-
DOGE just cleared its Ichimoku Kumo cloud for the first time in 87+ days, with a bullish Kumo twist close to confirming.
Technical Analysis of $DOGE
1-Hour Chart Analysis for Dogecoin Price Prediction
The 1H chart shows $DOGE breaking above a resistance zone and now retesting that breakout area from above.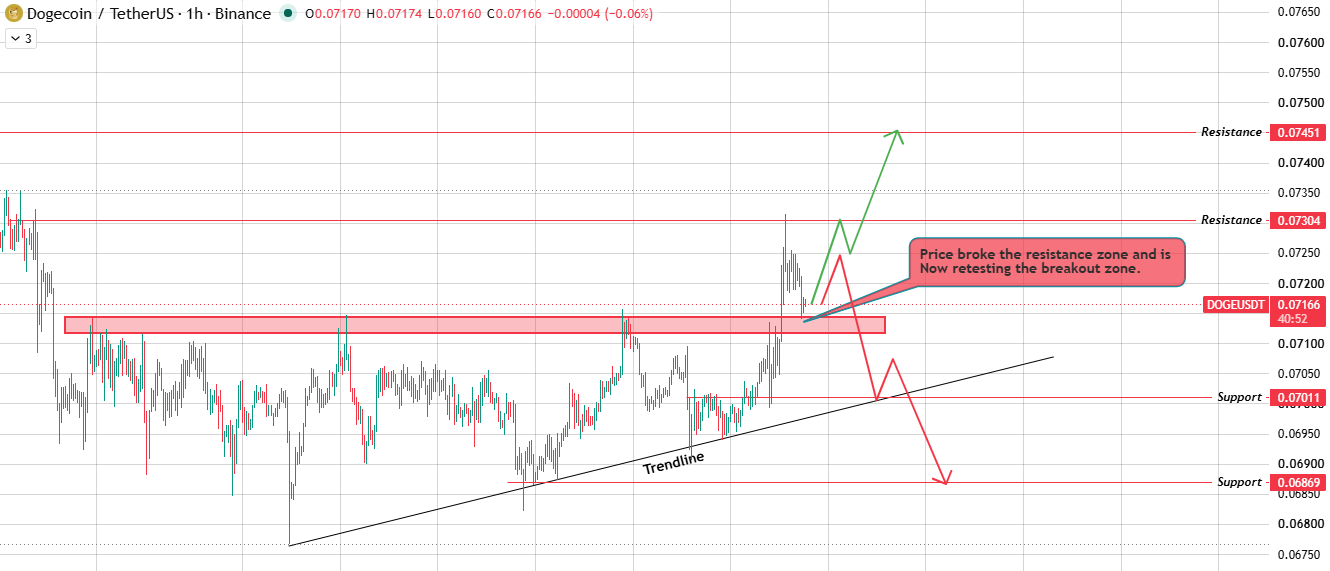
Source: Chart taken from TradingView.
If volume confirms the retest and price holds above the breakout zone, the next stop is resistance at $0.07304, then $0.07451.
But if the price gets rejected here and can't sustain the move, expect a slide down to test the rising trendline support.
A break below that trendline opens the door to $0.07011 and then $0.06869.
4-Hour Chart Analysis for Dogecoin Price Prediction
On the 4H chart, $DOGE is trading inside an ascending channel that has guided the recent uptrend.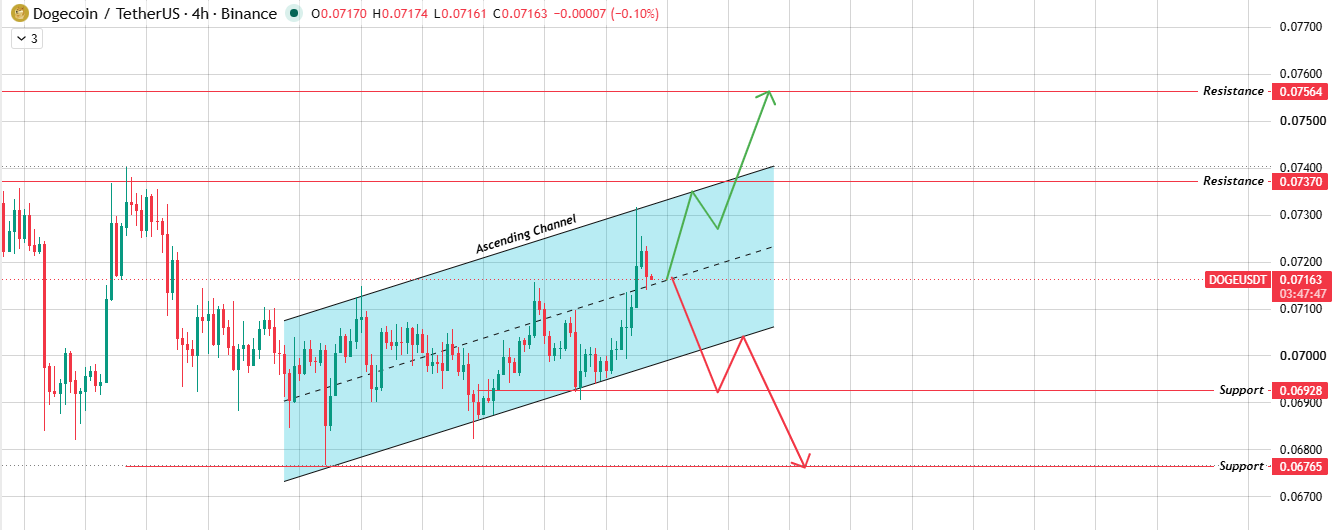
Source: Chart taken from TradingView.
A volume-backed break above the upper boundary of the channel clears resistance at $0.07370 first, then $0.07564.
A break below the lower boundary of the channel flips things bearish, with $0.06928 and $0.06765 as next support levels.
Both setups point the same way for now: $DOGE needs to hold its recent breakout and confirm with volume to keep the move alive.
Bull / Base / Bear Case
Scenario Trigger Levels Bull Hold above the $0.07166 retest zone (1H) or break above the $0.07370 channel top (4H) with volume $0.07451 – $0.07564 Base Price holds between $0.06928 and $0.07304. Sideways chop Bear Break below trendline support / $0.06928 channel bottom $0.06869 – $0.06765
Dogecoin News Today
Chart analysts flagged a notable Ichimoku Cloud signal on the 4-hour timeframe this week.
$DOGE has spent more than 87 days trapped inside and below the Kumo cloud, and the price has now cleared it for the first time in almost three months.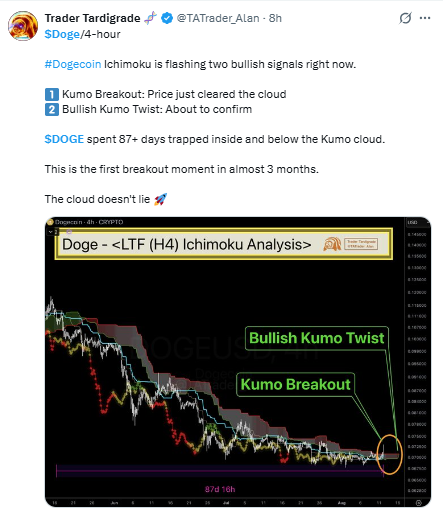
Source: Data Taken From @TATrader_Alan, X Account.
Alongside the Kumo breakout, a bullish Kumo twist is close to confirming on the same timeframe, a signal some traders read as an early sign of a broader trend shift after months of sideways-to-bearish price action.
Neither signal guarantees a sustained rally on its own, but a confirmed cloud breakout after such a prolonged consolidation is the kind of technical development that can support a bullish Dogecoin price prediction if the levels below hold up.
Glossary
Ichimoku Kumo Cloud: A shaded zone on the chart formed by two moving averages; price trading above the cloud is generally read as bullish, below as bearish.
Bullish Kumo Twist: A signal where the two lines forming the future cloud cross in a way that shifts the projected cloud from bearish to bullish.
Ascending Channel: Price moves higher here, bouncing between two upward-sloping trendlines until it breaks one side.
Liquidation: This happens when an exchange forcibly closes a leveraged position because the trader ran out of margin.
Support Zone: Think of it as a price floor where buying pressure has historically stepped in.
Resistance Level: The opposite of support, a ceiling where selling pressure tends to cap upward moves.
Methodology
Levels used in this Dogecoin price prediction come directly from chart data on the 1H and 4H timeframes.
Liquidation and volume figures are sourced from Coinglass. No price levels are extrapolated beyond what appears on the charts.
Disclaimer: This article is for informational purposes only and should not be treated as financial advice. Cryptocurrency markets are highly volatile, and prices can change quickly. Always do your own research and consult a financial advisor before making investment decisions.
Also read:

















