Dogecoin Price Prediction: Can DOGE Escape This Triangle Trap?


Dogecoin price prediction has been a hot search ever since this meme-born token clawed its way into the top 10 cryptocurrencies by market cap, something nobody took seriously when it launched as a joke back in 2013.
Years later, DOGE still trades on sentiment as much as fundamentals, and its market cap tends to move in lockstep with how Bitcoin and Ethereum are performing.
When BTC and ETH are running hot, that risk-on mood usually spills over into large-cap alts like Dogecoin.
Right now, DOGE is coiling right below a level that just won't crack. Here's what the setup actually looks like.
Where Is Dogecoin Trading Right Now?
At the time of writing, DOGE sits at roughly $0.0719, hovering just above a support shelf that's held for the last few sessions. It's not a dramatic price, but the setup around it is worth paying attention to.
Both the daily and the 4-hour charts are flashing classic consolidation patterns, and when two timeframes agree like this, a breakout (in either direction) tends to follow.
Dogecoin Volume Crashes 64% Since January - Here's Why
Here's something that doesn't get talked about enough. Dogecoin's daily trading volume has collapsed to somewhere between $360M and $380M in mid-2026, a steep drop from the $1B+ average it was running at the start of the year. 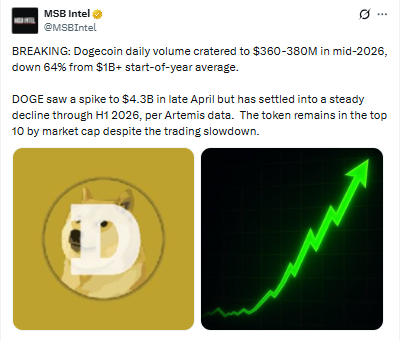
Source: Data Taken From X
There was a brief spike to $4.3B back in late April, but it's been a steady grind lower through the first half of the year since then.
Lower volume during a triangle squeeze usually means the market is waiting for a catalyst before committing either way.
DOGE is still holding its spot in the top 10 by market cap, so it's not a case of traders abandoning the asset entirely; it's more that everyone's sitting on their hands until the chart resolves.
Dogecoin Liquidation Data: Who's Getting Rekt Right Now?
As per liquidation & heatmap data taken from Coinglass, the liquidation heatmap tells its own story. Over the last 24 hours, $2.37M in DOGE positions got wiped out, and long traders took the bigger hit at $2.16M compared to just $207.32K in shorts.
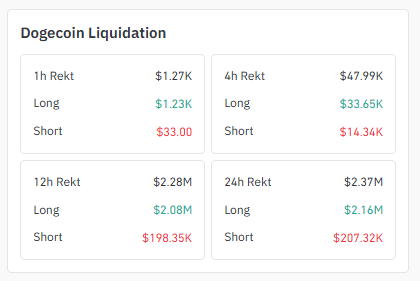
The 12-hour window shows a nearly identical pattern, $2.08M in longs liquidated against only $198.35K in shorts.
That's a lot of leveraged buyers getting caught offside during the recent slide. But zoom into the last hour, and things look calmer, only $1.27K total rekt, with longs and shorts both fairly light.
That kind of cooldown often shows up right before a fresh directional push, since it means the market has flushed out most of the over-leveraged positions on one side.
Volume-wise, Binance ($248.96M) and OKX ($160.33M) are doing the heavy lifting on futures, with Bybit, MEXC, and WhiteBIT filling out the mid-tier.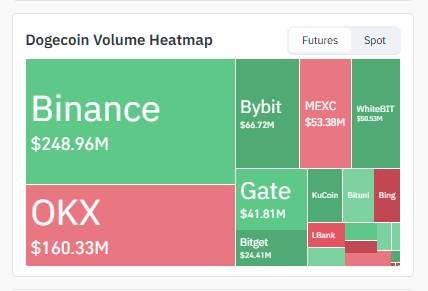 It's a fairly concentrated setup, which means moves on these two exchanges can swing sentiment across the board pretty quickly.
Dogecoin 4H Chart: Symmetrical Triangle Nears Its Apex
Drop down to the 4-hour timeframe, and the picture gets sharper. DOGE is compressing into a symmetrical triangle, with lower highs stacking against a flat support band near $0.0712–$0.0715. 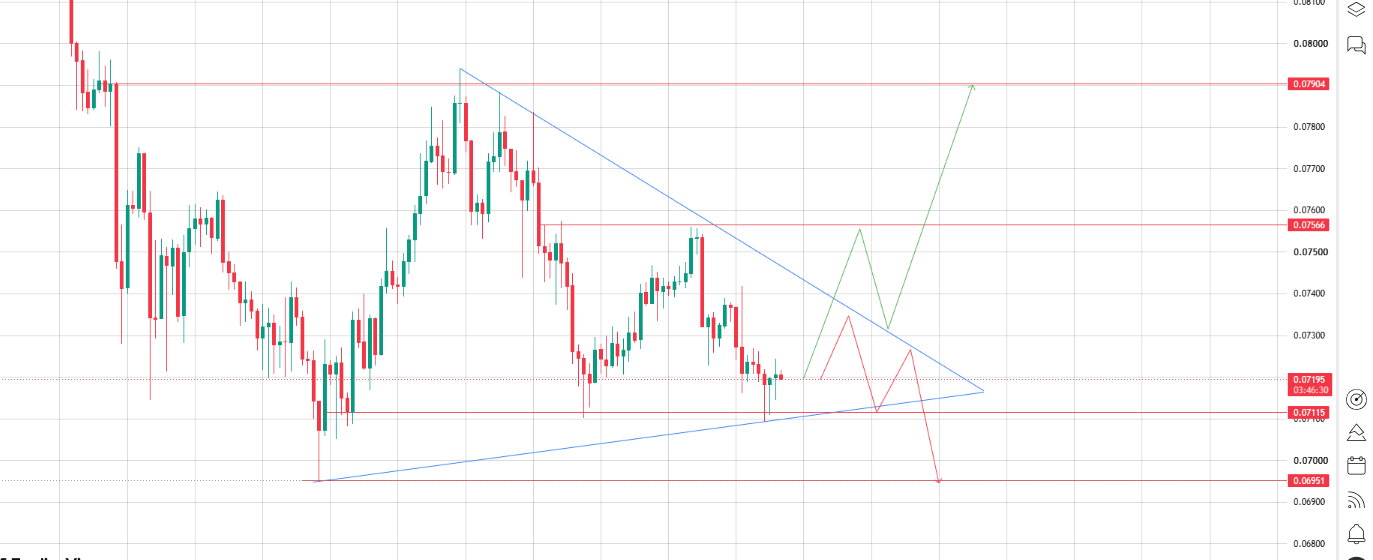
Source: Chart Taken From TradingView
The triangle's apex is close, which usually means the wait for a decisive move won't last much longer.
Key levels to track:
-
Resistance: $0.0757 first, then $0.0790
-
Support: $0.0712, with $0.0695 as the next cushion if that breaks
A move above $0.0757 would confirm bulls are stepping back in, opening the door toward $0.0790.
A break below $0.0712, on the other hand, tends to accelerate fast toward $0.0695.
Dogecoin 1D Chart: Descending Channel Still in Control?
Zoom out to the daily chart and you'll notice DOGE has been sliding inside a descending channel since the last major top near $0.105.
The price fell sharply through this channel, tapping the lower boundary around $0.0695 before finding some footing. 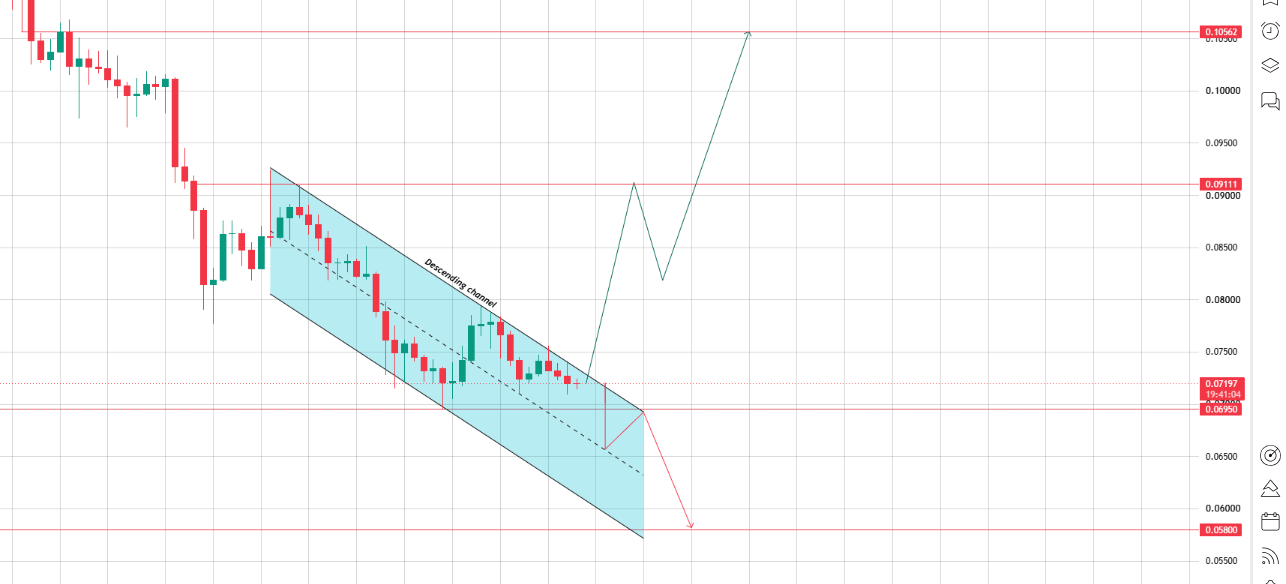
Source: Chart Taken From TradingView
Two levels matter most here. On the downside, $0.0695 and then $0.0580 are the channel's floor targets if sellers regain control.
On the upside, $0.0911 is the first real ceiling, and a clean breakout above the channel could eventually put $0.1056 back on the table.
Right now, price is coiling right near the lower edge of that channel, which is exactly where reversals tend to start brewing.
That said, a channel isn't broken until it's broken, so this is still technically a bearish structure until proven otherwise.
Dogecoin Price Prediction: Three Scenario to Watch
| Scenario | Trigger | Price Target |
|---|---|---|
| Bullish | Breaks and holds above $0.0757 | $0.0790, then $0.0911 |
| Neutral/Range | Stays between $0.0712 and $0.0757 | Sideways chop, no clear trend |
| Bearish | Loses $0.0712 support | $0.0695, then $0.0580 |
What Next for Dogecoin? Final Price Outlook
Put it all together and DOGE looks like a coiled spring right now.
The daily chart still leans bearish inside its descending channel, but the shrinking triangle on the 4H and the calming liquidation data suggest a decision point is close.
A close above $0.0757 flips the near-term bias bullish, with $0.0790 and eventually $0.0911 in view.
Fail to hold $0.0712, though, and the path of least resistance points back toward $0.0695 and $0.0580.
For now, the safest read is to wait for the triangle to actually break rather than guessing which side wins.
The volume drought means whichever direction gets confirmed could move fast once it does.
One more thing worth watching: DOGE's market cap tends to move in step with Bitcoin and Ethereum during broader bull phases.
If BTC and ETH keep pushing higher, that risk-on mood usually trickles down into large-cap alts like Dogecoin, which could give this triangle the extra push it needs toward $0.0790 and beyond.
A cooling BTC/ETH market, on the other hand, tends to strip that support away fast.
Disclaimer: This article is for informational purposes only and should not be considered financial advice. Cryptocurrency markets are volatile; please do your own research before making any investment decisions.

















