Dogecoin Price Prediction: DOGE Could Explode After Breakout

DOGE just did something worth watching. A pattern that held the price down for weeks finally cracked, and now the question isn't if it moves; it's how far.
This dogecoin price prediction breaks down exactly what happened and what could come next.
Current DOGE Price and Where It Stands Right Now
$DOGE is trading around $0.0743 right now. That's a small number, sure, but the setup behind it isn't small at all. One chart just broke out.
Another is still stuck inside a falling channel. Both stories matter, and both are worth walking through.
Social Sentiment Check: Doubts Around Ownership
Not everyone is bullish on the story behind $DOGE right now.
A post from BSCNews highlighted comments from Morgan Creek Capital founder Mark Yusko, who compared Elon Musk's SpaceX to Dogecoin, arguing both rely heavily on concentrated ownership. 
Source: Data Taken From X.
His point was that Musk controls the narrative around both, while everyday holders are the ones left carrying the risk.
It's a fair critique worth keeping in mind. Whale accumulation and concentrated control cut both ways: big holders can move price fast in either direction.
It doesn't cancel out the bullish chart setup, but it's a reminder that $DOGE's price action is often tied closely to headlines and sentiment around one person, not just technicals.
DOGE Liquidation Data: Big Money Getting Wiped Out
The liquidation heatmap shows some real damage happening. In the last hour alone, $30.18K got liquidated; almost all of it was long at $29.99K, with only $192.44 in shorts. That's a rough hour for anyone betting on the upside too early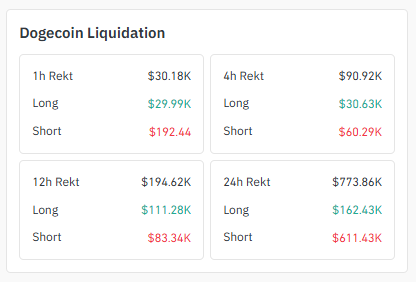
Source: Liquidation Data Taken From Coinglass.
Look at the 4-hour window, and it's $90.92K total, split $30.63K long against $60.29K short.
Started taking more pain there as the price pushed up. Zoom out to 12 hours, and it's $194.62K total, $111.28K long versus $83.34K short.
The 24-hour number is the big one: $773.86K total liquidated, with shorts taking the bigger hit at $611.43K against $162.43K in longs.
Over the full day, shorts got squeezed hard, which lines up with DOGE grinding higher into that triangle breakout.
Exchange Volume Heatmap: Where the Futures Action Is
Binance dominates DOGE exchange volume by a wide margin, running $336.28M in futures trading. OKX follows at $225.52M, then Bybit at $90.02M.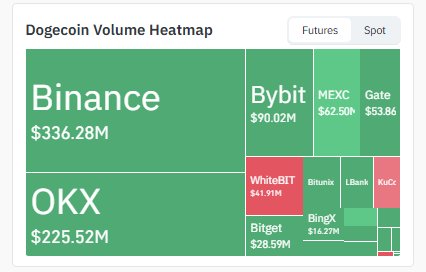 Source: Heatmap Data Taken From Coinglass
Behind those, MEXC ($62.50M), Gate ($53.86M), and WhiteBIT ($41.91M) keep decent volume going, with Bitget ($28.59M), BingX ($16.27M), and a few smaller venues rounding things out.
This much volume on the top two exchanges alone shows this isn't a thin, easily pushed move. Real traders are behind it.
4H Chart: Symmetrical Triangle Breakout Already in Play
Here's the exciting part. On the 4-hour chart, $DOGE was stuck inside a symmetrical triangle for a while, with two lines squeezing tighter and tighter.
That triangle has now broken to the upside. Price pushed above the top line and is trading around $0.074296.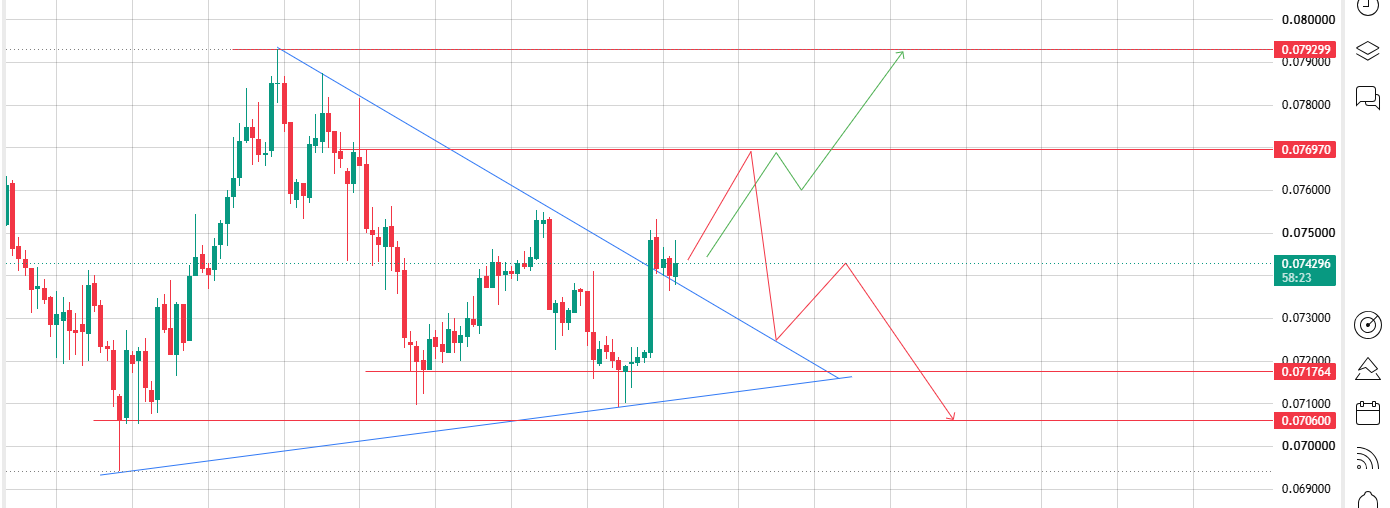
Source: Chart Taken From TradingView
With the breakout confirmed, $0.076970 is the first resistance level ahead. Break through that too, and $0.079299 becomes the next target above it.
But here's the honest part: not every breakout holds. Sometimes a fake breakout happens, where the price pokes above the line, gets everyone excited, and then falls right back inside the pattern.
If that happens here, watch $0.071764 as the first warning level and $0.070600 if the fakeout goes deeper. Always wait for a proper close above resistance before trusting a breakout fully.
1D Chart: DOGE Sits Inside a Descending Channel
On the daily chart, $DOGE was stuck inside a descending channel for weeks. Price kept making lower highs and lower lows, boxed in by two lines sloping down together. 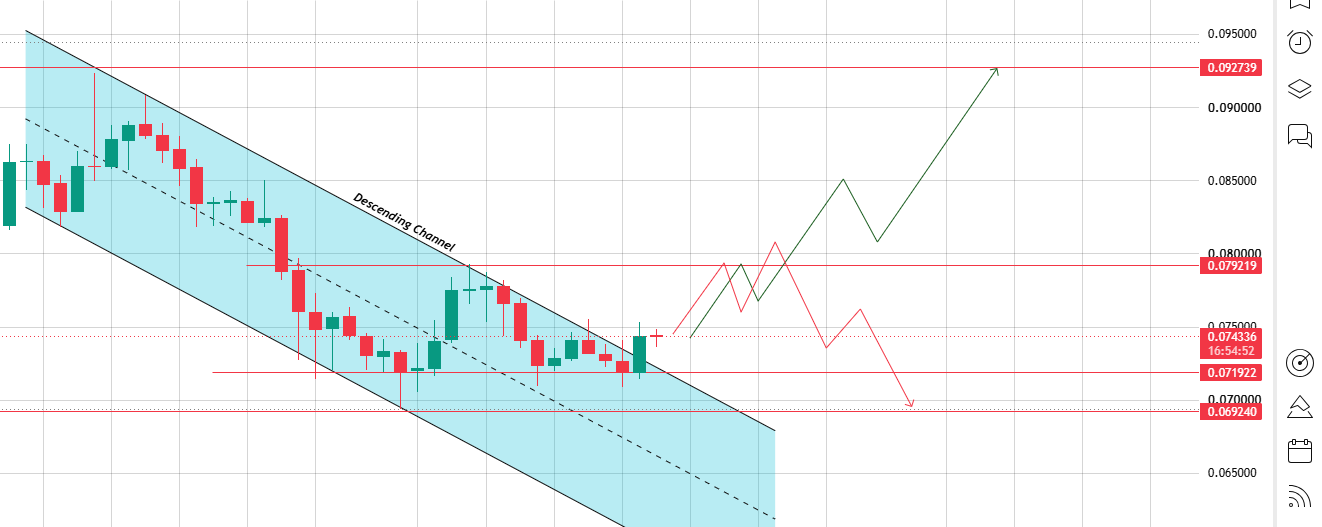
Source: Chart Taken From TradingView
Now a strong green candle has closed above the channel's upper line, trading near $0.074336, the first real sign that the channel could be breaking.
If this breakout holds, $0.079219 is the first target. Push past that, and $0.092739 comes into view; that would be a real shift in trend. But daily breakouts can fail too.
If the price slips back below the channel line, it could fall to a support zone at $0.071922, with $0.069240 further below that.
One green candle closing above the line is a good sign, but it still needs follow-through to confirm the breakout is real.
DOGE Three-Scenario Price Outlook: Bull, Bear, Neutral
Here's a simple table covering all three paths, including the bullish breakout case and the bearish breakdown risk:
| Scenario | Trigger | Price Target |
|---|---|---|
| Bullish Breakout | Price clears $0.076970 and then $0.079219 with strong volume. | $0.092739 |
| Neutral / Range-bound | Price stays stuck between $0.071764 and $0.076970, with no clean break. | $0.074296–$0.076970 |
| Bearish Breakdown | Triangle breakout turns into a fakeout; price falls below $0.071764. | $0.069240 |
Final Outlook: What Could Push DOGE Toward Resistance
Put it together and DOGE is at an interesting split point.
The 4-hour symmetrical triangle already broke upward, and now the daily descending channel is showing its own breakout candle too, both timeframes leaning the same way at once.
That's a stronger signal than either chart alone. Still, this needs a real fakeout risk kept in mind, since one green candle or one triangle poke above resistance doesn't guarantee a straight line up.
Wider market conditions will likely decide how far this goes.
DOGE tends to move harder when BTC dominance falls and money rotates into altcoins; a stable Bitcoin gives DOGE more room to run toward $0.079219 and beyond.
There's also an ETH correlation worth watching, since altcoin risk appetite often follows Ethereum's strength too.
If BTC and ETH hold steady while DOGE clears $0.076970, the path toward $0.092739 starts looking a lot more realistic.
If not, that channel resistance on the daily chart could hold DOGE back a while longer.
Disclaimer: This article is for informational purposes only and should not be taken as financial advice. Always do your own research before making investment decisions.
Also read:

















