Ethereum Price Prediction: Can ETH Reach $3,000 After Golden Cross?


Ethereum is holding steady above the $1,900 mark this week, and traders are watching closely to see what happens next. Strong ETF demand and a fresh on-chain signal have put $3,000 back on the radar for many analysts.
The world's second-largest cryptocurrency is trading near $1,913 at the time of writing, up modestly on the day. Behind that quiet price action, though, some bigger structural shifts appear to be building.
What is driving Ethereum's price today?
Spot Ethereum ETFs pulled in $92.15 million on August 6, 2026. That is the largest single-day inflow in three months.
This follows two other strong days. ETFs added $60.86 million on August 5 and $53.75 million on August 4. Cumulative net inflows now sit above $11.4 billion, based on data shared by market tracker Ash Crypto.
Institutions appear to be steadily adding ETH exposure. Total net assets held by these funds are now close to $10.64 billion.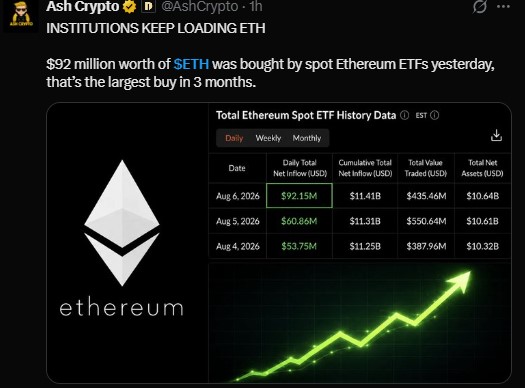
Is Ethereum's futures market showing strength or caution?
Derivatives data tells a more mixed story. According to Coinglass, Ethereum futures volume over 24 hours sits at $23.35 billion, down 37.29% from the prior period.
Open interest is nearly flat, down just 0.22% to $26.50 billion. Options volume dropped 24.45% to $468.06 million.
The long/short ratio on Binance sits at 2.0257, meaning long positions outnumber shorts by a wide margin. Top traders on Binance show a similar lean, with a long/short ratio of 1.3365.
Liquidation data shows shorts have taken the bigger hit recently. Over the past hour, $85.46K in short positions were liquidated compared to just $1.47K in longs. Over 24 hours, short liquidations reached $6.84 million versus $7.17 million in long liquidations, a closer balance.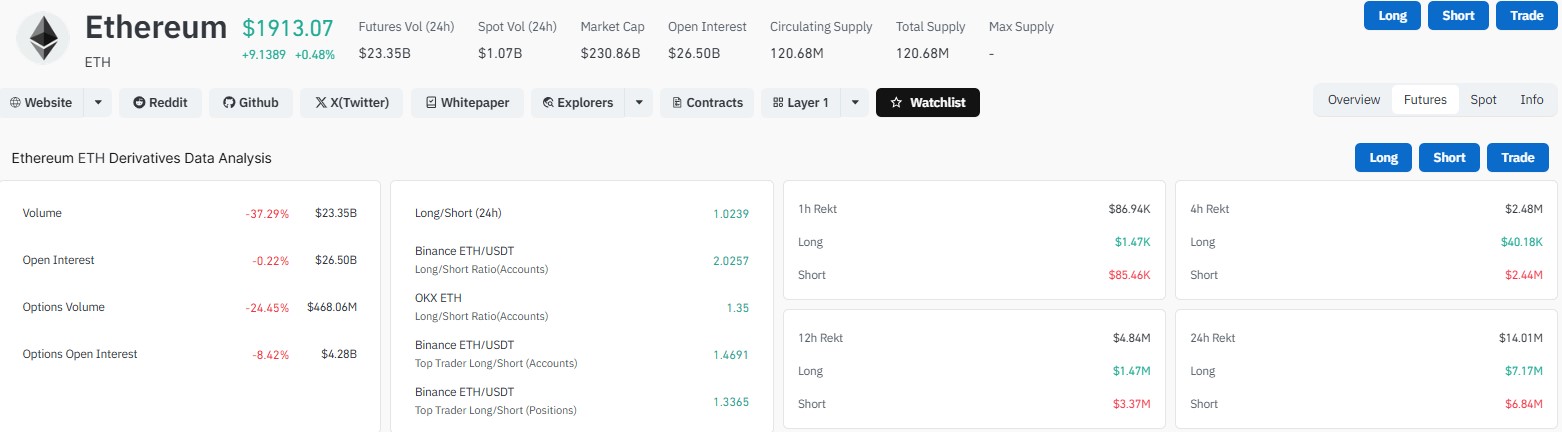
Can Ethereum hold above $1,900?
Analyst Ted Pillows pointed out that $ETH is still holding above the $1,900 level. He noted that Clarity Act voting has been delayed, but the broader picture for Ethereum still looks constructive.
If ETH can defend this level, a move toward $2,000 could follow next, according to his chart analysis. That level lines up with a resistance zone visible on recent price action going back to February.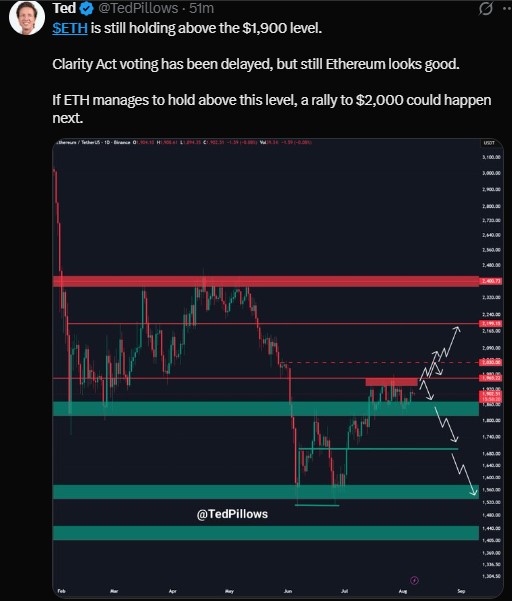
What does the MVRV golden cross mean for ETH?
A separate signal has caught attention across crypto circles. The altcoin recently broke above its MVRV 0.8 Pricing Band near $1,800.
This band has marked meaningful shifts in momentum in the past. When ETH clears this threshold, it has tended to push toward its Realized Price, which currently sits near $2,300.
Ethereum has also formed what analysts call an MVRV Momentum golden cross. Past instances of this pattern were followed by rallies of 50%, 166%, 74%, and 113%, though past performance does not guarantee future results.
ETH Market Snapshot
Metric | Value |
ETH Price | $1,913.07 |
24h Change | +0.48% |
Market Cap | $230.86B |
Futures Volume (24h) | $23.35B |
Open Interest | $26.50B |
Circulating Supply | 120.68M ETH |
ETF Net Inflow (Aug 6) | $92.15M |
Cumulative ETF Inflow | $11.41B |
Why is $3,000 seen as a key level for Ethereum?
If bullish momentum continues, $3,000 stands out as the next major level to watch. On-chain transaction data shows this zone as a significant resistance area.
More than 10 million ETH previously changed hands around that price. That kind of trading history often creates a wall of resistance, since many holders may look to sell once price returns to their entry point.
Whether Ethereum can work through that supply zone will likely depend on continued ETF demand and whether the broader crypto market holds its footing in the weeks ahead.
The bigger picture for ETH holders
None of this guarantees a straight line higher. Crypto markets remain volatile, and delayed regulatory decisions like the Clarity Act vote can shift sentiment quickly.
Still, the combination of rising ETF inflows, a defended $1,900 level, and a historically reliable momentum signal has given many Ethereum bulls something to point to this week.
Disclaimer
This article is for informational purposes only and should not be considered financial or investment advice. Cryptocurrency markets are highly volatile and unpredictable. Always do your own research and consult a licensed financial advisor before making any investment decisions.
















