Shiba Inu Price Prediction: $SHIB Could Enter a Powerful Bull Run


SHIB's had quite a ride. Back in October 2021, it hit $0.00008845, right at the peak of the whole meme coin frenzy, back when Elon Musk kept tweeting about his own Shiba Inu puppy and retail money poured in from everywhere.
That high feels like ancient history now. $SHIB trades over 94% below it today, sitting somewhere around $0.0000046.
So where does that leave this Shiba Inu price prediction? Price is coiled tight on the short-term chart, sitting right up against a falling line that's kept a lid on it for a while.
Clear that line with real buying, and there's genuine room to run.
Get pushed back again, though, and SHIB's more likely to drift lower before making another attempt.
$SHIB Live Market Data
SHIB is currently trading at $0.00000462, down 2.2% over the past day and 2.3% against BTC, ranging between $0.00000457 and $0.000004744. 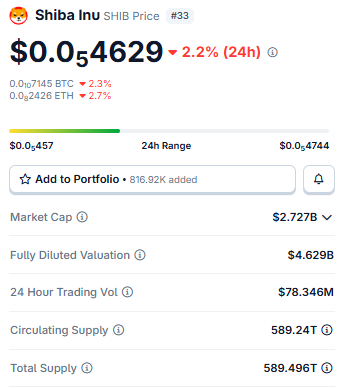
Source: $SHIB Market Cap Data Taken From Coingecko, data as of Aug 07, 2026. Figures may vary slightly across other tracking websites.
Market cap sits at $2.727B, and fully diluted valuation at $4.629B, since the circulating supply of 589.24 trillion is still a touch under the 589.496 trillion total.
Volume over the last 24 hours landed at $78.346M.
Liquidation Snapshot
the liquidation data, which fits a coin stuck this tight in range. $80.14K in longs got wiped over 24 hours versus $9.90K in shorts, small either way. 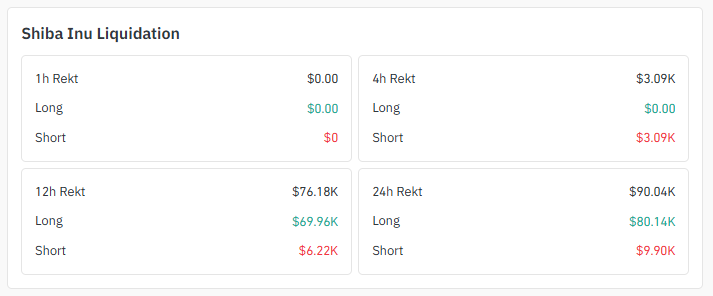
Source: Liquidation Data Taken From Coinglass.
Nothing at all liquidated in the past hour, honestly; a sign price just hasn't picked a direction yet.
Exchange Volume
OKX's out front on SHIB futures, $18.26M over 24 hours; LBank next at $10.45M; MEXC close behind at $8.20M. 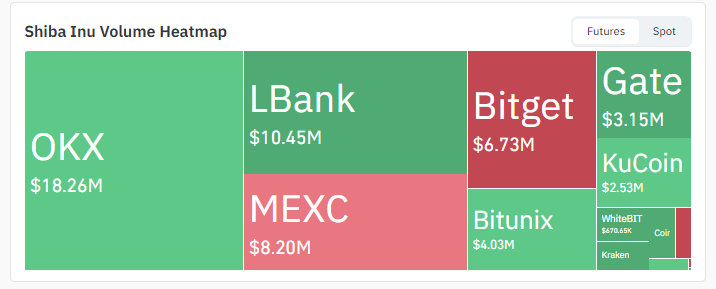
Source: Volume Heatmap Data Taken From Coinglass.
Bitget adds $6.73M, and Gate, Bitunix, KuCoin round things out somewhere between $2.5M and $4M apiece.
Spread that evenly; no single exchange is really carrying this number.
$SHIB Social Sentiment
The burn keeps humming along quietly in the background.
Shibburn clocked 6,624,999 SHIB destroyed over the past 24 hours, worth around $31 at today's price, a tiny dollar amount, sure, but proof the mechanism's still running. 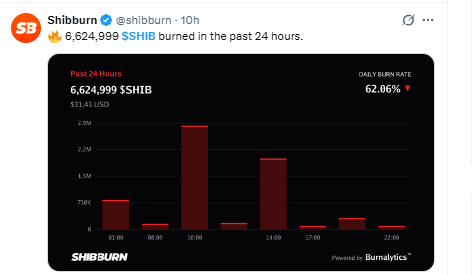
Source: Data Taken From @shibburn, X Account.
Whether burns this size actually move the needle on price is up for debate, but they do chip away at supply bit by bit, and that's part of the longer-term thinking behind this Shiba Inu price prediction.
Key Takeaways
-
SHIB's at $0.00000463, up 0.43% today, pressed right against a descending triangle pattern on the 4H chart.
-
Snap the falling trendline with volume, and $0.00000505 shows up first, and $0.00000558 after that.
-
Get rejected instead, and the price probably slides to $0.00000431, maybe $0.00000410.
-
SHIB's still sitting more than 94% below its all-time high of $0.00008845 from October 2021.
-
Shibburn tracked 6.6 million SHIB torched in just the last 24 hours.
4H Chart: Falling Triangle
Pull up the 4H chart and SHIB's grinding into a descending triangle, a falling line pressing down from above while a flat line holds firm underneath.
The price is right at that squeeze point. 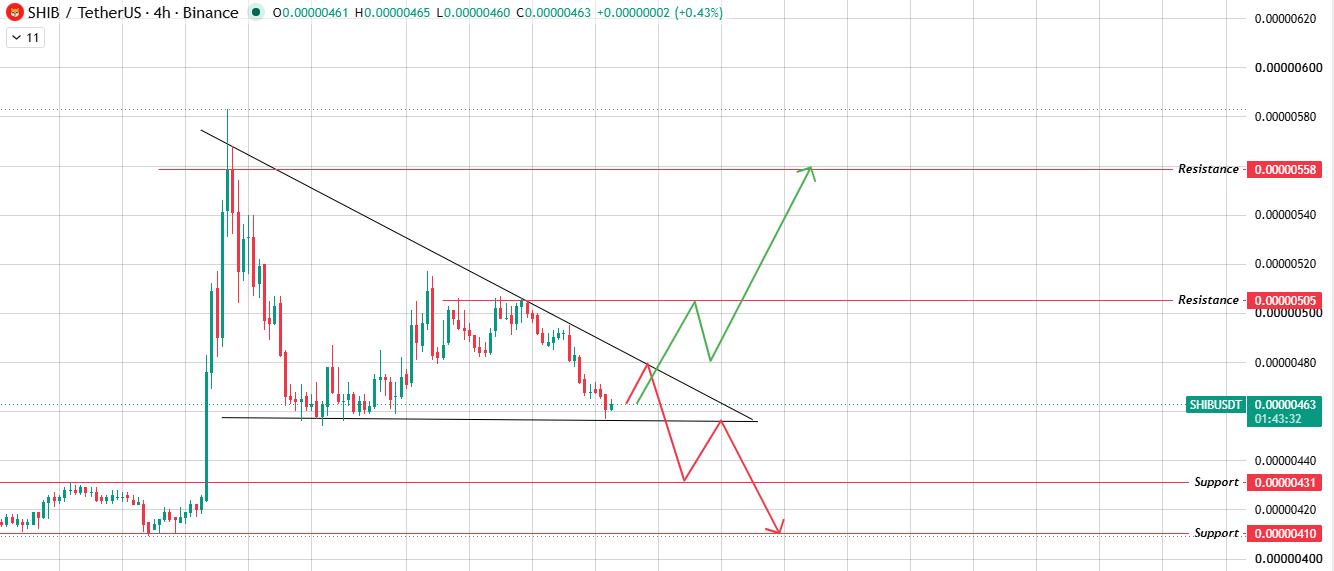
Source: Chart Taken From TradingView .
Clear break above the falling line with decent volume, and $0.00000505 opens up first, $0.00000558 possible if buyers keep at it.
Get turned away here instead, and a drop toward $0.00000431 looks likely, maybe $0.00000410 if sellers actually take over.
Bull, Base, and Bear Scenarios
Risks
SHIB doesn't move in isolation; no coin really does. A shift in BTC dominance could easily override whatever this triangle is signaling.
Triangle setups fail sometimes too, so it pays to wait for real volume before trusting the first candle through either line.
Glossary
Descending Triangle: A falling resistance line meeting a flat support line underneath, usually leading somewhere once the pattern gets tight enough.
Liquidation: When a leveraged trade gets forced shut because the price moved too far the wrong way.
Methodology: Levels in this Shiba Inu price prediction come straight from TradingView chart analysis on the 4H timeframe, alongside liquidation, volume, and market data pulled at the time of writing. Numbers can shift as the market does.
Disclaimer: This article is for informational purposes only and does not constitute financial advice. Cryptocurrency markets are highly volatile and speculative. Always do independent research and speak with a licensed financial advisor before making investment decisions.
















