Up 42% Week, Can $DOT Reach $2 Now? Polkadot Price Prediction


Polkadot is having a moment $DOT just broke free from a months-long downtrend, right as excitement builds around a dotUSD stablecoin referendum running at 97.5% in favor on-chain.
The coin rise 42.5% this week alone, the biggest weekly gain in the top 50, and 24-hour volume has surged past $338M.
This Polkadot price prediction looks at whether the breakout has legs. Here's what the chart shows.
Market data was checked on September 9, 2026, at 01:12 UTC-3.
Polkadot Price Prediction Today: Market Overview
Metric | Value |
Price | $1.2061 |
24h Change | +12% |
Market Cap | $2.05B |
FDV | $2.53B |
24h Volume | $437.1M |
Vol/Mkt Cap (24h) | 21.4% |
Total Supply | 1.7B |
Max Supply | 2.1B |
Circulating Supply | 1.7B |
Source: Data from CoinMarketCap as of September 9, 2026, at 01:12 UTC-3. Figures may vary slightly across other tracking websites.
Polkadot Crypto News Today: dotUSD Referendum Fuels $DOT Rally
As Per a tweet from The Defiant, Polkadot holders are voting on dotUSD, a protocol-native stablecoin with no separate issuer, seeded with $2.5M in USDT and $2.5M in DOT. 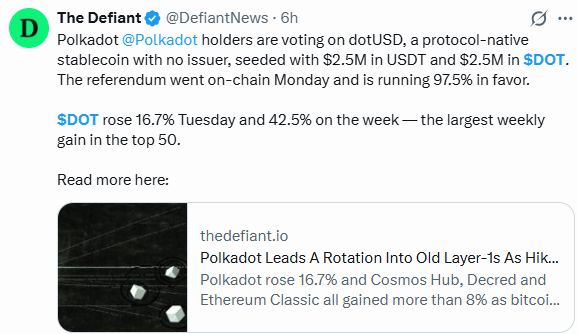
Source: Data From X
The referendum reportedly went on-chain Monday and was running at 97.5% in favor.
The same post noted DOT rose 16.7% Tuesday and 42.5% for the week the largest weekly gain among the top 50 tokens by market cap, a catalyst that's now central to most Polkadot price prediction discussions.
$DOT Price Prediction: Trading Volume Surges Past $338M
A separate tweet flagged that Polkadot's 24-hour trading volume crossed $338M, lining up with the price action following the dotUSD vote. 
Rising volume alongside a breakout usually signals real participation behind the move rather than a handful of large orders, adding weight to the current $DOT price prediction 2026 setup.
$DOT Price Prediction Technical Analysis
Pair: DOT/USDT · Market: Spot (Crypto) · Exchange: OKX · Timeframe: 1D · Source: TradingView · Timestamp: September 9, 2026, 01:12 UTC-3
DOT is trading at $1.2061 after breaking above the descending trendline that had capped the price since the May highs.
The rally was sharp, and the price is now testing the $1.1900 zone, which lines up with the trendline breakout area.
The chart's liquidity mapping shows a thick resistance band building up between $1.4005 and $2.4032 above the current price, with a lighter support band below $1.0473.
Holding above $1.1900 keeps the reclaim intact losing it would put the breakout back in question.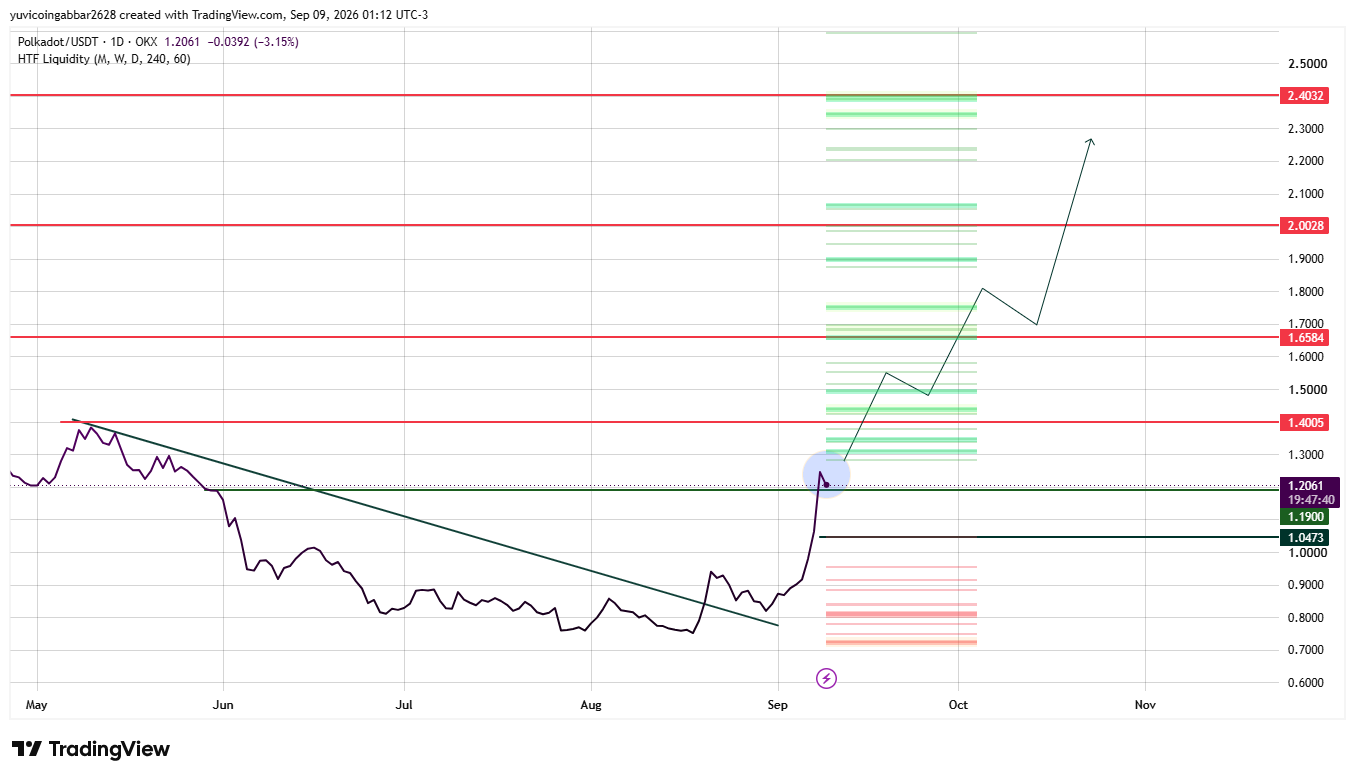
$DOT Future Price: Key Levels
Level Type | Price |
Resistance 4 | $2.4032 |
Resistance 3 | $2.0028 |
Resistance 2 | $1.6584 |
Resistance 1 (nearest) | $1.4005 |
Immediate Price Reference | $1.2061 |
First Confirmed Support (trendline zone) | $1.1900 |
Deeper Support | $1.0473 |
Polkadot Price Forecast: Bull Case vs Bear Case
Bull case: Holding above $1.1900, the reclaimed trendline zone keeps the breakout structure intact, especially with the dotUSD referendum still generating fresh Polkadot crypto news.
A confirmed close above $1.4005 would open the door toward $1.6584 and eventually $2.0028.
Bear case: A close back below $1.1900 would undercut the trendline reclaim and suggest the rally was a governance-driven spike rather than a lasting trend shift.
Losing $1.0473 would expose deeper downside with little chart support until much lower levels.
$DOT Price Prediction: Triggers and Invalidation Levels
Scenario | Trigger | Likely Outcome | Invalidation Point |
Bullish continuation | Hold above $1.1900, break $1.4005 | Move toward $1.6584 and $2.0028 | Close below $1.1900 |
Range consolidation | Rejection at $1.4005, hold above $1.1900 | Sideways chop between $1.19 and $1.40 | Break below $1.1900 |
Bearish breakdown | Lose $1.1900 and $1.0473 | Extended pullback to lower liquidity zones | N/A |
Can $DOT Reach $2.40?
$2.4032 is the highest resistance level marked on the chart.
Getting there would need DOT to clear $1.4005, then $1.6584, and hold above $2.0028 a multi-stage climb that likely needs the dotUSD narrative and volume trend to keep strengthening.
Polkadot Price Forecast and Outlook
Zooming out, DOT's break above its multi-month downtrend is a meaningful structural shift, not just a one-day pump.
If the dotUSD referendum passes and momentum holds, the Polkadot price forecast favors a retest of $1.4005 and $1.6584 over the coming weeks, with $2.00 plus realistic only if broader market conditions cooperate.
The bigger question is whether this governance catalyst turns into sustained network activity or fades once the news cycle moves on.
Polkadot Price Prediction 2026: Expert View
According to CoinGabbar analysts, The trendline break plus a governance catalyst and rising volume make this a stronger setup than a typical bounce, but $1.1900 is the level that decides whether it sticks.
Watch that zone closely over the next few sessions.
Disclaimer
This piece is for informational purposes only and isn't financial advice. The levels and scenarios above are based on technical chart analysis and publicly available data at the time of writing, and crypto markets can move sharply within hours, so past patterns don't guarantee future outcomes. It's worth doing independent research and considering your own risk tolerance before acting on any of the levels discussed here.

















