Dogecoin Price Prediction: Will This Bullish Pattern Launch $DOGE?


This dogecoin price prediction starts with where DOGE actually stands: trading at $0.0693 today, down 4.2% on the day.
That's a long way off its all-time high of $0.74, hit back in May 2021 during the meme-coin mania DOGE is still sitting roughly 90% below that peak, even after years of Elon Musk tweets, X Payments integration talk, and two US spot ETF launches.
For context, Dogecoin remains the largest meme coin by market cap at around $10.75 billion, well ahead of Shiba Inu, its closest rival in the category.
DOGE has the deeper exchange liquidity and the only Foundation-backed ETF in the space, while SHIB leans more on its Shibarium ecosystem and token-burn story.
The detailed levels, chart structure, ETF flows, and whale activity behind today's price are broken down below.
DOGE Price Snapshot (July 24, 2026)
| Metric | Value |
|---|---|
| Price | $0.0693 |
| 24h Change | -4.2% |
| Market Cap | $10.758B |
| Fully Diluted Valuation | $11.847B |
| 24h Trading Volume | $749.071M |
| Circulating Supply | 155.198B DOGE |
| Max Supply | Uncapped |
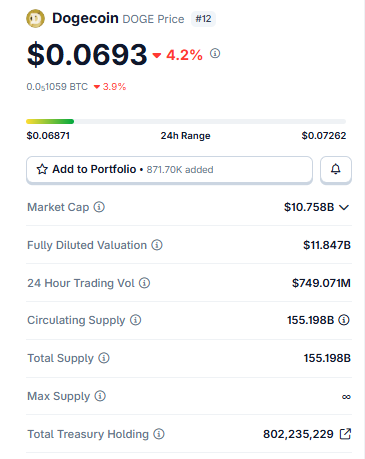
Source: Data Taken From Coingecko, data as of July 24, 2026. Figures may vary slightly across other tracking websites.
Some venues print a few tenths of a cent higher or lower depending on the exact moment of the quote, which is just a normal spread across exchanges, not a discrepancy worth flagging.
Dogecoin's price is uncapped; its supply keeps its price target math grounded strictly in demand and volume rather than scarcity, which is why every level in this piece is pulled directly off the charts instead of modeled off a fixed-supply framework.
Liquidation Data: Longs Have Been Paying the Price
CoinGabbar's derivatives read from the liquidation heatmap data show a heavily one-sided picture over the last 24 hours:
Across every window beyond the last hour, long positions have absorbed the overwhelming majority of the damage. $8.19M of the $8.75M wiped out in 24 hours came from longs. 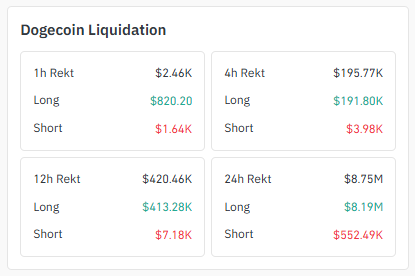
Source: Liquidation Data Taken From Coinglass, at 24-07-2026
That's consistent with the 4.2% daily drawdown: leveraged bulls got caught overextended into the trendline rejection, and that flush is part of what's pinning price near current levels.
A genuine trendline break from here would need fresh spot-driven demand rather than another leveraged long squeeze, since much of that positioning has already been cleared out.
Exchange Volume Heatmap
Exchange volume is concentrated on two venues. Binance leads with $448.40M in futures volume, followed by OKX at $322.54M. 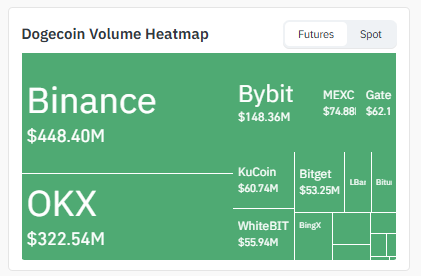
Source: Heatmap Data Taken From Coinglass, at 24-07-2026
Bybit ($148.36M), MEXC (~$74.9M), Gate ($62.1M), KuCoin ($60.74M), WhiteBIT ($55.94M), and Bitget ($53.25M) round out the rest, with smaller pools on LBank and BingX.
Binance and OKX combined account for the majority of futures activity, meaning order flow on those two exchanges will likely lead any decisive trendline or wedge break.
Social Sentiment: Merge Mining Debate Resurfaces
Not much price talk in the community right now; it's mostly about protocol direction. Billy Markus, one of Dogecoin's co-founders, jumped into the ongoing merge mining debate this week and didn't hold back.
His take: pulling merge mining doesn't fix anything real, and the push to remove it looks more self-serving than technically necessary.
Source: Data taken from BSCN, X Account
Fair to note he's been on the sidelines of actual Dogecoin development since 2014, but people still listen when he talks, and his comments have kept the AuxPoW security argument alive in DOGE circles.
None of this moves price directly; it's governance noise, not a catalyst, but debates like this can quietly sour sentiment if they drag on too long without a resolution.
4-Hour Chart: The Falling Trendline Is the Whole Story
DOGE closed the last 4H candle at $0.06937, basically flat, down just 0.07%, but that number hides the real tension on the chart.
Price is pinned right beneath a falling trendline that's rejected every single bounce attempt since the highs near $0.0805. 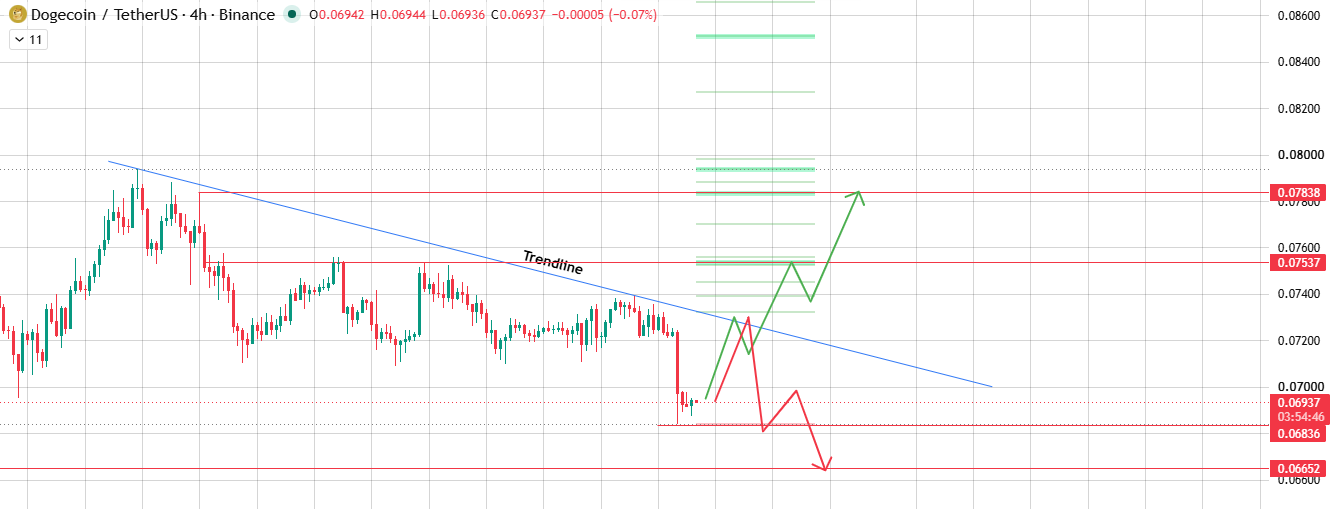
Source: Chart Taken From TradingView, at 24-07-2026
Underneath it, a tight little support shelf around $0.0684–$0.0688 is doing all the work.
Here's the part worth actually paying attention to. The chart's liquidation clusters are noticeably heavier stacked above the current price than below it.
That imbalance matters more than people give it credit for. Hold the $0.0684 shelf, force a bullish breakout through the trendline, and price has a fairly obvious magnet waiting overhead.
First stop at $0.07537, stretching to $0.07838 if the move has legs.
Flip it around, though. If the trendline keeps doing its job and $0.0684 finally cracks, there isn't much cushion underneath.
A bearish breakdown from there could move fast toward $0.06652, and there's not a lot standing in the way.
1-Day Chart: Descending Wedge Meets a Wolfe Wave Setup
Zooming out to the daily chart, the story changes shape a bit. DOGE has been carving out a descending channel that actually reads more like a textbook descending wedge both boundaries sloping down, but the lower one flattening out faster than the upper.
That's the pattern traders watch for a dogecoin falling wedge breakout, because wedges shaped like this tend to resolve upward more often than not. 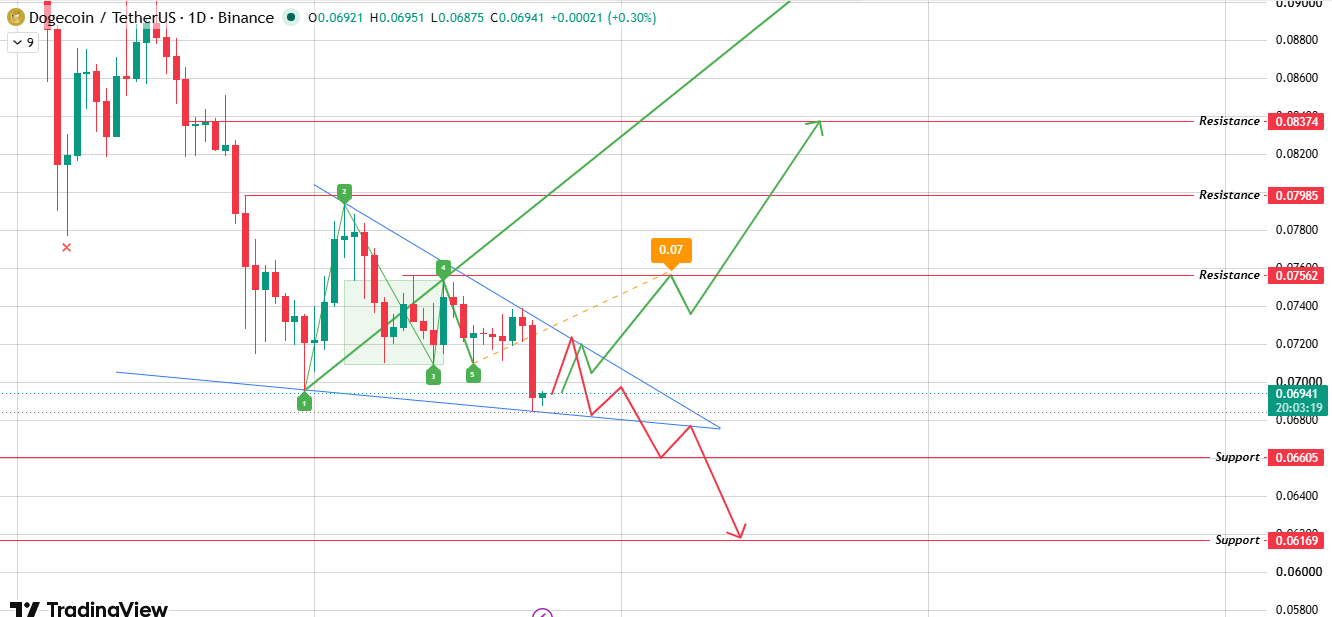
Source: Chart Taken From TradingView, at 24-07-2026
The swing points labeled 1 through 5 trace the structure cleanly, and candle 4 marks the most recent test of the upper boundary, right around $0.075.
Right now the price is leaning on the wedge's lower boundary for support. Break above the upper boundary with conviction, and the first resistance level at $0.07562 comes into range, then $0.07985, then $0.08374 as the wedge's full extension.
The Wolfe Wave marking on the chart is pointing at that nearer target, $0.07562, as the more realistic first move.
Not an instant sprint to $0.08374. One step at a time.
If the lower boundary can't hold, the picture flips fast.
Daily support drops to $0.06605, and a deeper breakdown opens the door to $0.06169.
DOGE Scenario Table
Dogecoin ETF News: Access Without Appetite
Since the dogecoin etf launch conversation is a recurring search query, it's worth being straight about where things actually stand.
$DOGE now has two US-listed spot ETFs REX-Osprey's DOJE, which launched back in September 2025, and 21Shares' TDOG, which debuted on Nasdaq in January 2026 as the first SEC-approved spot $DOGE product and the only one carrying an official Dogecoin Foundation endorsement.
Combined, the two funds hold somewhere around $20 million in assets, a number that's barely moved since launch.
That's the real Dogecoin ETF news: institutional access exists, but the inflows haven't followed. Worth watching, not worth pricing in as a catalyst yet.
Whale Wallets Are Quietly Loading Up
While retail sentiment gets pulled around by the merge mining debate, dogecoin whale accumulation has been building in the background.
Wallets holding 100 million DOGE or more have climbed to a record cluster controlling well over 100 billion tokens combined.
Big holders adding size while price chops sideways near multi-week lows is often read as conviction that a bottom is forming, though it's not a guarantee, and whale wallets can just as easily be exchange or custodial addresses rather than single conviction bets.
Still, it's the kind of on-chain detail that belongs in any serious read of the Dogecoin latest news cycle right now.
BTC Dominance and ETH Correlation
DOGE's setup doesn't exist in isolation. Its ETH correlation and broader BTC dominance trends still frame the ceiling and floor for altcoin moves like this one.
A wedge breakout in DOGE carries far more follow-through when BTC and ETH are stable or trending up than when majors are chopping sideways or falling.
Traders leaning into the bull case here should weigh Bitcoin's own trend structure alongside DOGE's chart before sizing positions.
Final Outlook
Two timeframes, one question. Can buyers defend $0.0684–$0.0688 long enough to actually force a breakout?
That's really all the 4H trendline and the 1D wedge are asking, just from different angles.
The long liquidation flush over the past 24 hours has already cleared out a chunk of the excess leverage, which sounds bad on the surface but can actually make for a cleaner setup if real demand shows up.
Heavier liquidity sitting above the price gives the bulls something to aim for, and the Wolfe Wave marking keeps expectations grounded: $0.07562 first, not $0.08374 in one move.
Lose $0.0684, though, and the bias flips fast, with $0.06652 and $0.06169 next in line. Whale wallets adding size into this chop is a mild tailwind for the bull case, and ETF flows staying flat means this move, if it comes, is likely to be spot and retail-driven rather than institutionally fueled.
Glossary
-
Falling Trendline: Draw a line connecting the lower highs as price grinds down, and that's your trendline. It acts like a ceiling until price finally punches through it.
-
Descending Wedge: Two downward-sloping boundaries squeezing toward each other. Looks bearish on the surface, but this pattern has a habit of breaking upward more often than not.
-
Liquidation Heatmap: Basically a map of where leveraged traders get forced out of their positions. Those price zones tend to pull prices toward them, almost like a magnet.
-
Wolfe Wave: A five-wave structure traders use to project where price is likely headed next, based on how the earlier swings played out.
Methodology
Every level, trendline, and wedge boundary in this piece came straight off the TradingView 4H and 1D DOGE/USDT charts, plus the Coinglass liquidation data and exchange volume heatmap shared for this analysis all reviewed on July 24, 2026.
Nothing here is extrapolated or modeled beyond what's actually visible on those charts; if a number isn't on the chart, it's not in the article.
Price, market cap, and supply figures come from that same snapshot. And one honest disclaimer: this isn't financial advice.
$DOGE moves fast, and these levels can shift the moment new candles print.
Disclaimer: This article is for informational purposes only and is not financial advice. Cryptocurrency markets are volatile; do your own research before investing.

















