Hedera Price Prediction: HBAR Nears Critical Price Zone


Hedera (HBAR) is trading near $0.06944, up 1.16% over the past 24 hours, just as the network confirmed the launch of HashSphere, a private, enterprise-grade network built on Hedera's distributed ledger technology.
The timing puts this Hedera price prediction at an interesting juncture: HBAR is pressing against the upper boundary of a multi-month descending channel on the daily chart, even as the intraday trend already shows signs of a range breach.
Whether buyers can turn that short-term strength into a confirmed higher-timeframe move is the key question ahead.
Can HashSphere Improve HBAR's Outlook?
HashSphere is a private network layer for enterprise users, offering enhanced transaction privacy and enterprise-grade security while staying fully interoperable with the public Hedera network.
It's a meaningful step toward institutional adoption, but it's a network development rather than an immediate demand catalyst; nothing about it changes HBAR's near-term supply or trading dynamics.
The modest 24-hour gain suggests the market is treating the news as constructive background rather than a reason to chase price. For now, technical structure remains the bigger driver of price action.
Are HBAR Derivatives Supporting the Breakout?
Open interest across the Hedera derivatives market is holding near $82.46M, well below earlier peaks, suggesting leverage remains light as traders wait for the daily breakout to confirm.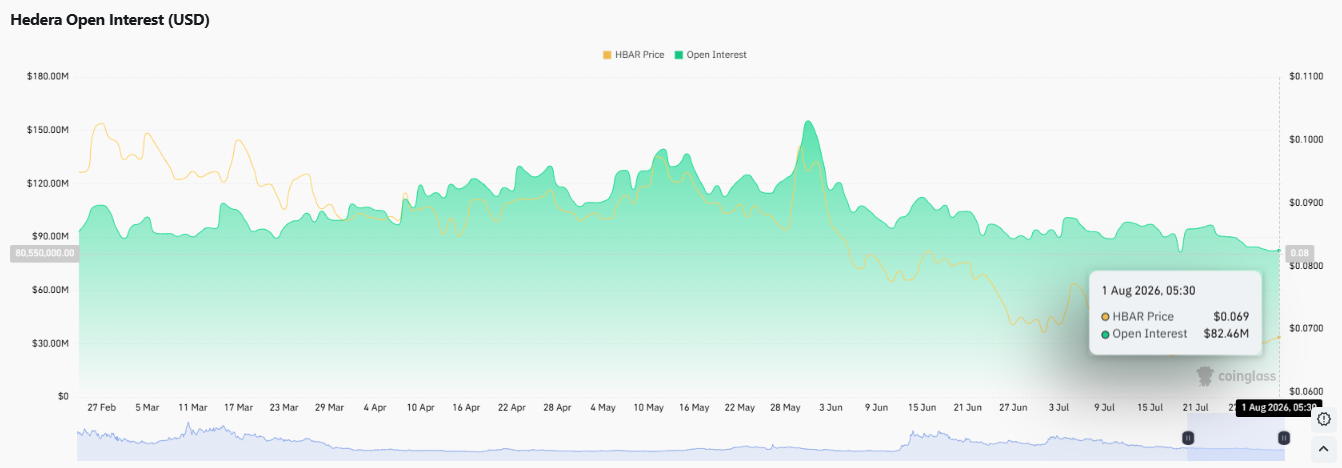
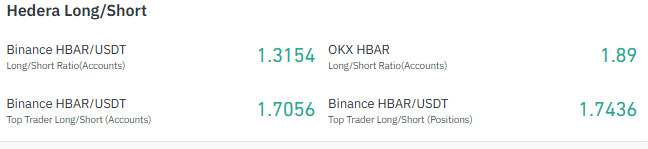
Positioning leans clearly long: Binance accounts show a ratio of 1.3154, OKX sits at 1.89, and Binance's top traders are even more skewed bullish at 1.7056 (accounts) and 1.7436 (positions).
Liquidations reinforce this — over the past 24 hours, short positions made up roughly $76.88K of the $105.91K total liquidated, far outweighing longs.
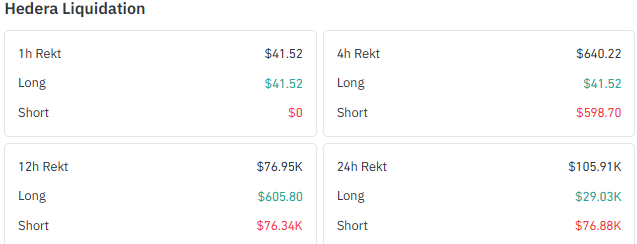
Altogether, the data leans bullish, though positioning alone hasn't yet forced a confirmed range breach on the daily chart.
Is HBAR Recovering or Still in a Downtrend?
HBAR's price action tells two stories at once. The 24-hour gain of 1.08% shows short-term strength, but that sits inside a much deeper decline down 21.61% over 90 days, 34.64% year-to-date, and 72.38% over the past year.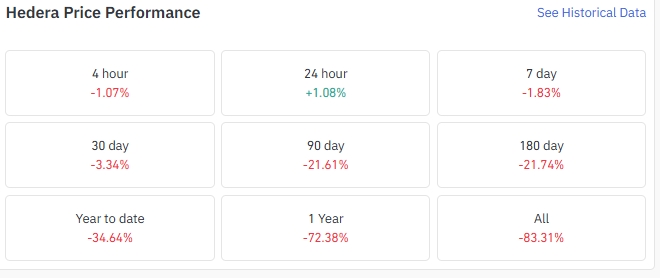
The 7-day and 30-day figures, down 1.83% and 3.34%, respectively, confirm the broader trend hasn't turned yet.
The current bounce looks more like a technical pause than a reversal of the dominant downtrend.
Data taken by coinglass
Has the 1-Hour Breakout Changed the Trend?
On the 1-hour TradingView chart, $HBAR broke out of an ascending channel and is trading around $0.0694, with RSI at 59.42, reflecting healthy, non-overheated momentum.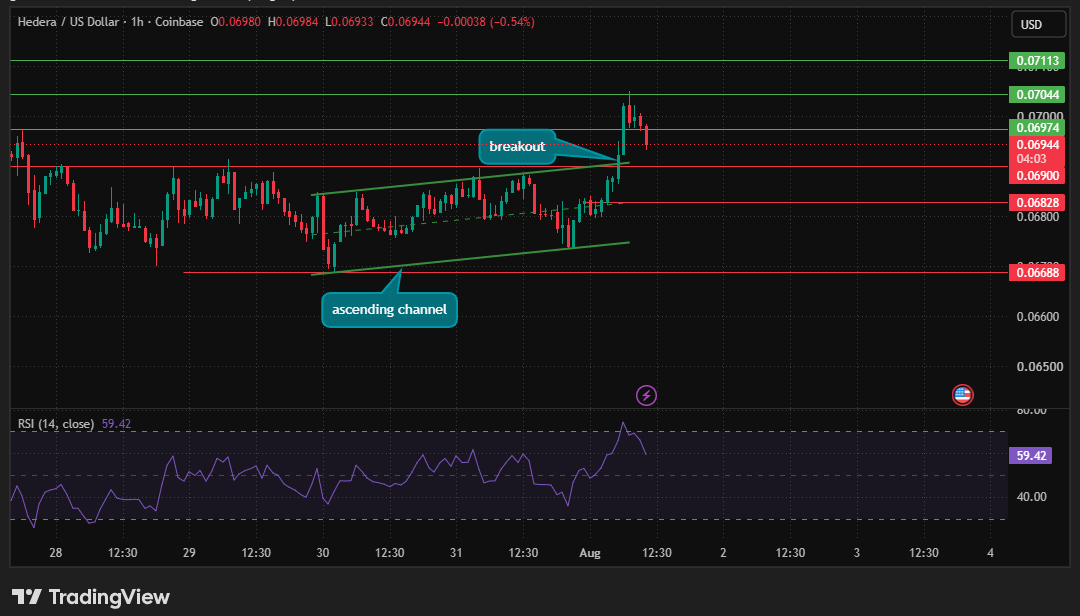 Resistance sits at $0.06974, $0.07044, and $0.07113; support is layered at $0.06900, $0.06828, and $0.06688.
The $0.0690–$0.0694 breakout zone is now the level buyers need to defend.
Holding above it keeps the intraday structure intact, while a slide below $0.06828 would undercut the price surge and hand control back to sellers.
Can HBAR Break Above the Descending Channel?
HBAR remains inside a descending channel on the daily timeframe, with price currently trying to test its upper boundary.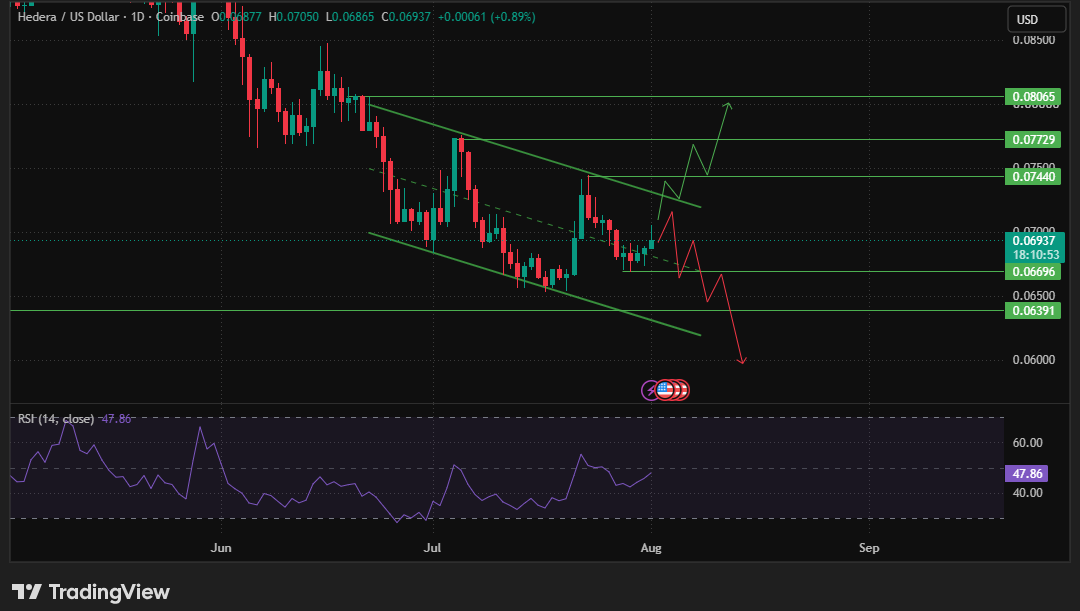 Daily RSI reads 47.86, a neutral level reflecting the tug-of-war between the intraday breakout and the still-unbroken downtrend.
Resistance stands at $0.07440, $0.07729, and $0.08065; support sits at $0.06696 and $0.06391.
A confirmed close above $0.07440 would be the first real evidence the channel is breaking down, aligning the daily structure with the strength already shown on the 1-hour chart.
Until then, the higher-timeframe trend remains technically bearish.
What Is HBAR's Daily Sentiment?
NEUTRAL
What Comes Next for HBAR?
The scenarios below build on the technical levels established above for this Hedera price outlook.
Scenario | Trigger | What It Suggests |
Bullish | Daily close above $0.07440 | Confirms the channel breakout and aligns the daily chart with the 1-hour structure; opens the path toward $0.07729 and $0.08065, with long-skewed positioning adding fuel if shorts are forced to cover. |
Base Case | The price holds between $0.06696 and $0.07440 | Continued consolidation inside the descending channel; RSI stays near neutral and positioning remains long-skewed without a decisive breakout either way. |
Bearish | Daily close below $0.06696 | Reopens downside toward $0.06391 and invalidates the recent 1-hour breakout, putting short-term buyers back on the defensive. |
HBAR's setup comes down to a fight between a confirmed 1-hour breakout and a daily chart that hasn't yet followed through.
The $0.07440 daily resistance is the level that matters most; a confirmed close above it would align both timeframes and validate this HBAR technical analysis as the start of a larger structural shift.
Until then, traders should watch how price behaves around the $0.0690 intraday breakout zone.
Disclaimer: This analysis is for informational purposes only and does not constitute financial advice. Cryptocurrency markets are volatile, and readers should conduct their own research before making investment decisions.
1 month ago
i have a problem with my dogecoin in wallet, i lost over $50,000 last week trying to investment not knowing i was investing with a scammer when the times comes for me to withdrawal my savings it was no where to be found then a friend ask me to contact SYLVESTER BRYANT at Yt7cracker@gmail. com if i am serious in getting all what has been stolen from me , After contacting him i follow his procedures and instruction after some time he was able to recover back my stolen dogecoin and also apprehend the scammer














.jpg)




