Hoodrat Price Prediction: Can the 418% Rally Continue?


Something small and slightly ridiculous just moved a lot of money in a very short window, and traders want to know if it still has room left.
The Rat Coin Nobody Saw Coming Until Today
Hoodrat price prediction talk is spreading fast this week, and it's not hard to see why. A coin most people had never heard of a few days ago just posted one of the sharpest moves in the entire memecoin space.
Turns out, timing and internet culture can move markets faster than any roadmap ever could. Traders who caught it early are sitting on serious gains, and everyone else is asking if there's still time to get in.
This isn't a slow grind higher either. It's the kind of move that makes you check the chart twice, and that raises a bigger question the market hasn't answered yet.
Why This Sudden Hoodrat Coin Surge Has Traders Watching
Hoodrat is trading near 0.01378 dollars after a move that most traders did not see building. The coin is up over 418 percent in the past 24 hours alone, and that kind of jump does not happen quietly.
Basically, this is a meme-driven token that lives on the newly launched Robinhood Chain, an Arbitrum-based network that went live just days ago. It's already drawing comparisons to other top memecoins chasing fresh liquidity this cycle.
But here's what most traders are missing: volume followed the meme, not the other way around. Trading volume over the last day sits close to 13.9 million dollars, which is massive for a coin this young.
Here's the thing: attention like this rarely stays put for long. It either turns into a real community or it fades the moment the next shiny token shows up.
Hoodrat Coin Snapshot: Price, Supply and Market Data Today
| Field | Detail |
|---|---|
| Coin Name | Hoodrat |
| Ticker Symbol | HOODRAT |
| Blockchain | Robinhood Chain (Arbitrum-based) |
| Today High | $0.01736 |
| Today Low | $0.01079 |
| RSI Level | 86.06 |
| Token Type | Memecoin |
| Token Category | Community and Social Token |
| Market Cap | $13.55M |
| 24H Trading Volume | $13.96M |
| Circulating Supply | 1 Billion HOODRAT |
| 24H Change | +418% |
Source: Data by CoinGecko
What Is Hoodrat and Why It Suddenly Matters
Hoodrat is a meme token built on the Robinhood Chain, a network Robinhood launched earlier this month to move stocks and other assets on-chain. It joined a wave of tokens launching alongside fresh crypto presale projects and community drops on the same chain.
Why This Coin Matters Now Beyond the Hype Cycle
And that's exactly the problem with dismissing it too quickly. The Robinhood Chain itself is brand new, and early breakout tokens on any fresh chain tend to pull outsized attention amid broader altcoin market trends right now.
We pulled up the recent chain activity, and the first thing that stood out was how fast liquidity formed around meme tokens the moment the network went live. That alone explains part of this move.
There's also a narrative angle worth noting. Robinhood's own CEO has publicly acknowledged meme activity on the chain, and that kind of visibility, even when unofficial, tends to pull more eyes from traders scanning crypto exchanges for the next breakout name.
Hoodrat Technical Price Analysis: What the Chart Is Really Saying
Price broke out of a clean ascending channel on the hourly chart, and that breakout is the reason this rally looks structurally different from a random pump.
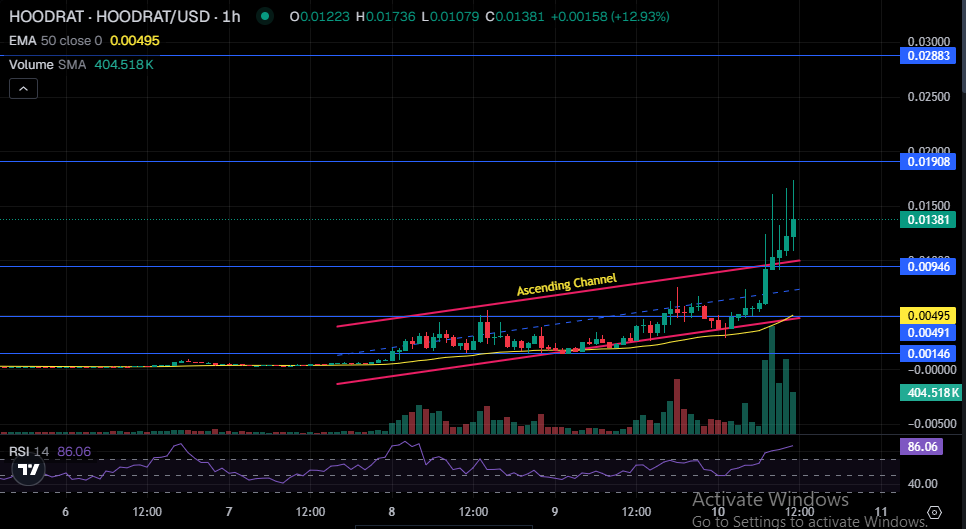
Source: Charting by Gecko Terminal
The 50 EMA sits far below current price at 0.00495, confirming buyers have been fully in control since the move began. RSI at 86.06 is deep in overbought territory, though, and that's not something to ignore.
Three. That's roughly how many resistance zones stand between the current price and the coin's all-time high.
Immediate resistance sits at 0.01908, with a bigger wall at 0.02883 above that.
Support now rests near 0.00946, and losing that zone would weaken the entire bullish structure fast. Invalidation sits at 0.00491, right around the EMA itself.
Hoodrat vs Other Fresh Memecoins on New Blockchains
Compared to other early movers launching alongside new chains, Hoodrat's volume to market cap ratio is unusually high, roughly matching its own market cap in a single day.
That kind of ratio puts it in the same speculative bracket as other early breakout tokens tied to Robinhood Chain, a Layer 2 network built on Arbitrum technology that Robinhood launched to bring faster and cheaper onchain trading. Anyone tracking crypto price predictions in this cycle knows how quickly that kind of edge can fade once new tokens arrive.
Hoodrat Short-Term Price Prediction: Next Few Weeks
Short-term price action will likely stay choppy given how overbought RSI currently reads, with pullbacks normal at this stage. Broader moves like the current Bitcoin price outlook often shape how fast that speculative capital rotates.
| Timeframe | Bearish Target | Base Target | Bullish Target | Key Trigger |
|---|---|---|---|---|
| 24 Hours | $0.01079 | $0.01380 | $0.01690 | Volume holding steady after the spike |
| 3-7 Days | $0.00946 | $0.01450 | $0.01908 | Weekly close above the resistance zone |
| 2-4 Weeks | $0.00760 | $0.01600 | $0.02000 | Continued attention on Robinhood Chain |
Watch the 0.00946 zone closely. Losing it changes this entire picture.
Hoodrat Long-Term Price Prediction: Looking Further Ahead
In the long term, everything depends on whether Robinhood Chain keeps pulling in fresh liquidity.
| Timeframe | Bearish Target | Base Target | Bullish Target | Catalyst Needed |
|---|---|---|---|---|
| 3 Months | $0.00491 | $0.00900 | $0.02100 | Sustained Robinhood Chain adoption |
| 6 Months | $0.00300 | $0.01100 | $0.02500 | New exchange listings and liquidity growth |
| End of Year | $0.00150 | $0.01300 | $0.03500 | The chain becomes a lasting memecoin hub |
| 2027 Outlook | $0.00080 | $0.01500 | $0.05000 | Robinhood Chain matures beyond speculation |
The long-term case is weak on fundamentals and strong only on narrative, so treat these numbers as speculative at best.
Three Hoodrat Price Scenarios Traders Should Prepare For
Worst Case: Interest in the Robinhood Chain fades quickly. Price slides back toward the low support zones as volume dries up.
Base Case: Price consolidates between support and resistance while the market decides if this coin has staying power, similar to patterns seen during the last broader crypto market rally.
Best Case: The chain keeps growing, and Hoodrat becomes one of its recognized mascots, pushing price toward new highs on fresh volume.
| Scenario | Price Range | What Triggers It |
|---|---|---|
| Worst Case | $0.00050 - $0.00491 | Attention shifts elsewhere and buying momentum fades. |
| Base Case | $0.00700 - $0.01500 | Sideways consolidation as the market digests the recent rally. |
| Best Case | $0.02000 - $0.05000 | Chain adoption accelerates and trading volume remains strong. |
Key Hoodrat Price Levels Every Trader Should Watch
Resistance zone: 0.01908 stands as the first real wall, with 0.02883 as the bigger test above it.
Support zone: 0.00946 is the level buyers need to defend to keep this trend intact.
Invalidation zone: A close below 0.00491 would flip the short-term structure bearish.
Hoodrat Analyst View and Final Thoughts on This Rally
The chart setup right now looks stretched but structurally sound, and that's an unusual combination. Checking the Fear and Greed Index alongside RSI gives a fuller read on just how stretched sentiment has become.
RSI at 86 says this move is overheated. But the ascending channel breakout says buyers still have not lost control.
A weekly close above 0.01908 would confirm continuation toward the next resistance band near 0.02883. Fail there, and expect a pullback toward support first.
One external factor worth tracking: how much liquidity actually stays on Robinhood Chain once the initial hype settles, alongside any listings on the coin events calendar worth watching.
The most important level right now is 0.00946. Hold it, and the bulls stay in charge.
Lose it, and this turns into just another meme that ran too hot too fast.
Disclaimer: This article is for educational purposes only and does not constitute financial advice. Crypto markets are volatile. Consult your investment advisor before making any investment decision.
Also read:

















