Hyperliquid Price Prediction: 28.5% Upside to $77 Breakout


Hyperliquid is shaping up to be one of the more compelling setups on the board right now.
Hyperliquid price prediction outlook has strengthened after a decisive break above a multi-week resistance trendline, and on-chain data released just hours ago adds another layer to the story that traders will not want to miss.
The levels discussed reflect the daily timeframe and should be rechecked as new candles close, since price is still working through this breakout structure.
HYPE Market Data Overview
HYPE is trading at $59.905, up a modest 0.16% over the past 24 hours.
Futures volume for the period stands at $1.72B against spot volume of $74.29M, a wide gap that points to derivatives traders driving most of the recent price discovery.
Open interest sits at $2.55B against a market cap of $15.06B, and circulating supply matches the full total and max supply at 252.54M HYPE, meaning there is no future dilution overhang from unreleased tokens.
The heavy tilt toward futures activity means short-term volatility is likely to stay elevated, even though the broader structure on the daily chart looks constructive.
Source: CoinGlass, August 18, 2026.
Methodology and Data Sources Behind This HYPE Forecast
This HYPE price forecast draws from the HYPE/USDT perpetual contract on Binance, tracked on the 1-day timeframe through TradingView.
Every support and resistance figure here comes from marked swing points and the trendline structure visible on that chart, not from a separately calculated indicator.
Market figures are pulled from CoinGlass, liquidation numbers from CoinGlass's Hyperliquid liquidation tracker, and the accumulation data point below from an on-chain wallet tracking account.
The outlook covers the near term, roughly the next handful of daily candles, and will need a fresh look once the price either extends the breakout or loses the current support zone.
HYPE Liquidation Data Shows Shorts Under Pressure
Unlike setups where long positions absorb most of the pain, HYPE's liquidation data over the past day tells the opposite story.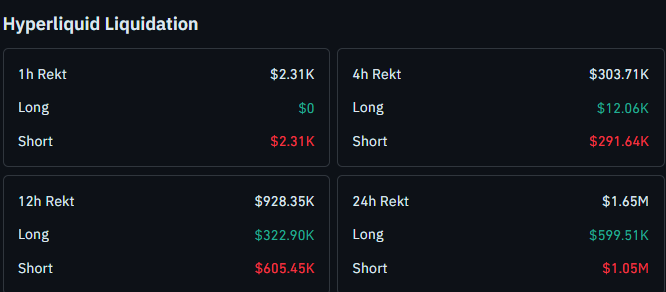
In the last hour, short-side liquidations totaled $2.31K with zero long-side liquidations recorded.
Over 4 hours, short-side liquidations reached $291.64K compared to just $12.06K on the long side.
That pattern holds over longer windows too.
The 12-hour figures show $605.45K in short-side liquidations against $322.90K in long-side liquidations, and the 24-hour total reached $1.65M, with $1.05M coming from shorts and $599.51K from longs.
This consistent short-side dominance suggests traders betting against the move have been squeezed repeatedly as price pushed through resistance, which often adds fuel to an ongoing uptrend rather than exhausting it.
Source: CoinGlass, Hyperliquid liquidation data August 18, 2026.
Fresh Whale Accumulation Adds to the HYPE Price Prediction
A notable on-chain signal surfaced early today.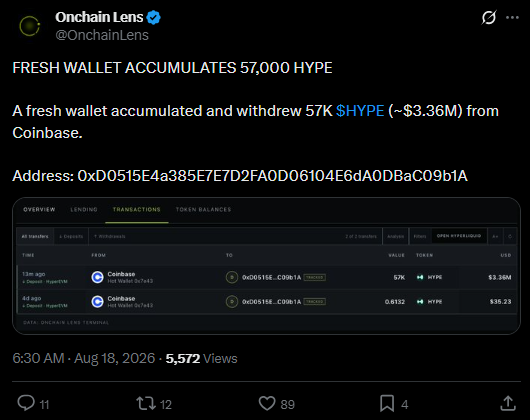
According to Onchain Lens on X, dated August 18, 2026, a previously inactive wallet accumulated and withdrew 57,000 HYPE, worth approximately $3.36M, directly from Coinbase.
The post identifies the receiving wallet address and shows two separate withdrawal transactions from Coinbase hot wallets into this single address.
Large withdrawals from exchange wallets into private holdings are generally read as accumulation, since it removes tokens from immediately available exchange liquidity and signals an intent to hold rather than trade short term.
Combined with the short-side liquidation data above, this points toward accumulating demand rather than distribution at current levels, though a single wallet's activity should not be treated as conclusive on its own.
Source: Onchain Lens on X, August 18, 2026, 6:30 AM.
HYPE Technical Analysis: Reading the Trendline Breakout
Hyperliquid has been climbing along a defined ascending trendline over recent sessions, a structure formed by a series of higher lows.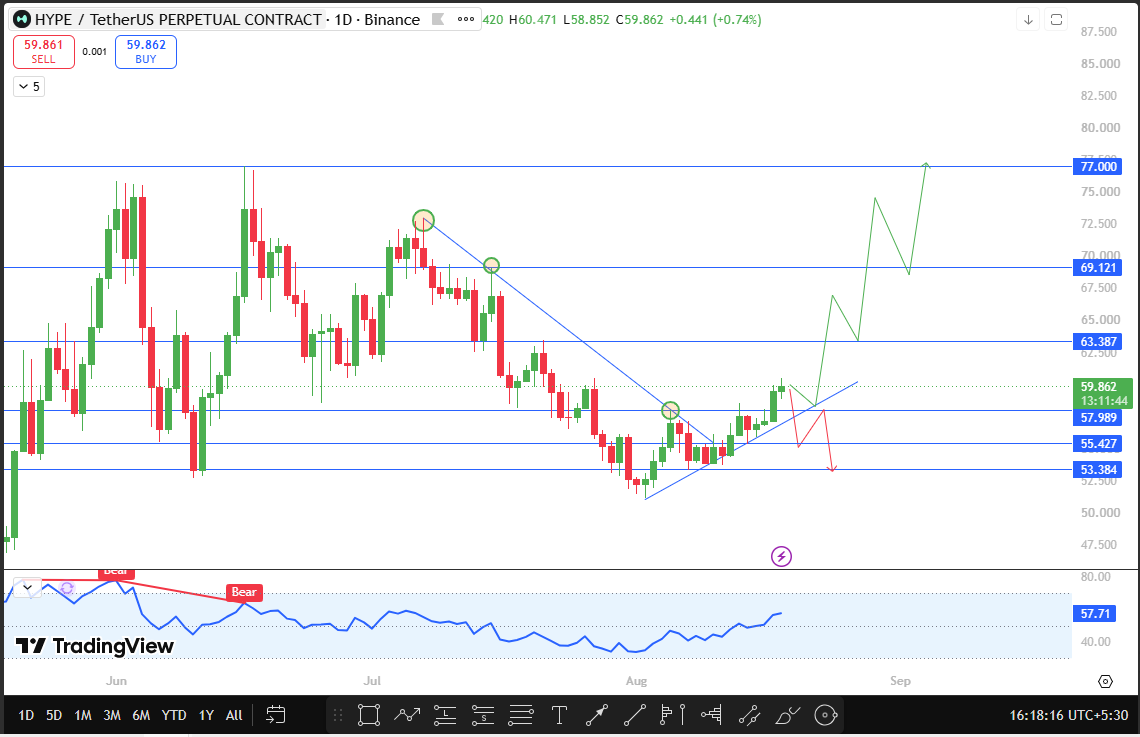
That uptrend recently intersected with a longer descending trendline connecting the prior lower highs, and price broke through that descending trendline on a bullish candle backed by noticeably stronger volume than the candles around it.
What stands out is that HYPE has not just broken this trendline but has continued to sustain above it in the sessions since, which adds credibility to the breakout compared to a single-day spike that quickly fades.
The current momentum reading on the chart's oscillator sits at 57.71, comfortably in positive territory without looking overheated.
The setup now hinges on whether HYPE can hold above $57.989.
A failure to sustain above this zone, followed by a break and close below $55.427, would undercut the bullish trendline breakout and shift focus toward the next support level.
HYPE Support and Resistance Levels to Watch
Type | Level | % From CMP | Note |
Resistance 3 (Major) | $77.000 | +28.5% | Old swing high |
Resistance 2 | $69.121 | +15.4% | Old swing high |
Resistance 1 (Near-term) | $63.387 | +5.8% | Old swing high |
Key Support to Hold | $57.989 | -3.2% | Recent breakout retest zone |
Support 1 (Breakdown Trigger) | $55.427 | -7.5% | Trendline breakout level |
Support 2 | $53.384 | -10.9% | Next support on confirmed breakdown |
HYPE Risk-Reward Table
Case | Trigger | Target |
Bullish | Price sustains above $57.989 | $63.387, then $69.121, then $77.000 |
Bearish | Break and close below $55.427 with no reclaim. | $53.384 |
What Would Change This HYPE Price Prediction
Continued daily closes above $57.989 would keep the bullish trendline breakout thesis intact and support a move toward the resistance zones outlined above.
If HYPE instead fails to hold that level and breaks below $55.427 on a confirmed close, the breakout would be invalidated and $53.384 becomes the level to watch next.
It is also worth tracking whether further large wallet withdrawals from exchanges continue, since a repeat of today's accumulation pattern would reinforce the bullish case.
Risk Considerations for HYPE Traders
The wide gap between futures and spot volume means leveraged positioning is doing much of the work behind this move, which raises the chance of sharp swings around the key levels above.
A short squeeze can also unwind quickly if momentum stalls, so traders should treat the current liquidation skew as supportive context rather than a guarantee that upside continues uninterrupted.
Bull, Base, and Bear Case for HYPE
Bull Case: Price holds above $57.989 and extends the trendline breakout, pushing toward $63.387 first, then $69.121, with the major resistance at $77.000 as the extended target.
Base Case: Price consolidates between $55.427 and $57.989 over the next few sessions as the market digests today's whale accumulation and liquidation data before committing to a direction.
Bear Case: price loses the $57.989 zone, breaks and closes below $55.427, and retests support at $53.384.
Glossary
CMP: Current Market Price, the live trading price of an asset at the time of writing.
Open Interest: The total value of outstanding futures or perpetual contracts that have not yet been settled or closed.
Liquidation: The forced closure of a leveraged trading position when losses reach a level the exchange requires to protect against further losses.
Ascending Trendline: A rising line drawn along a series of higher lows, used to track the strength of an uptrend.
Descending Trendline: A falling line drawn along a series of lower highs, marking resistance until it is broken.
Disclaimer
This article is for informational purposes only and does not constitute financial advice. Cryptocurrency markets are highly volatile, and prices can move sharply in either direction. CoinGabbar and the analyst do not hold a position at the time of publication. Readers should conduct their own research and consult a qualified financial advisor before making any investment decisions.







.webp)








