PAX Gold Price Prediction: PAXG 2026-2030 Outlook, Bullish Crossover?


Gold just went digital, and it's on the move. PAXG is holding a fresh bullish breakout right now, and the real question isn't today's price it's where this could be by 2030.
This PAX Gold price prediction breaks down PAXG's current setup and lays out a full 2026 to 2030 outlook, so you can see the bigger picture before everyone else does.
Market data was checked on August 18, 2026, at 15:53 IST.
PAXG Price Right Now:
Metric | Value |
Price | $4,386.52 |
1D Change (chart) | -0.63% |
Market Cap | $1.91B |
FDV | $1.91B |
24h Volume | $151.2M+ |
Vol/Mkt Cap (24h) | 7.89% |
Liquidity/Mkt Cap | 1.01% |
Total Supply | 436.94K $PAXG |
Max Supply | No cap |
Circulating Supply | 436.94K $PAXG |
Holders | 86.22K |
Source: Data from CoinMarketCap as of August 18, 2026, at 15:53 IST. Figures may vary slightly across other tracking websites.
PAXG Price Prediction Chart: Technical Analysis
Pair: PAX Gold/USD · Market: Spot (Crypto) · Timeframe: 1D · Source: TradingView · Timestamp: August 18, 2026, 15:53 UTC+5:30
PAXG current price is $4,386.52, consolidating inside a shaded range between roughly $4,313.23 and $4,440.68 after breaking above the descending trendline that had capped every rally since the February high.
That trendline broke up with a bullish EMA crossover in early August, where the shorter $EMA moved above the longer one, and the price has held above both since.
RSI (Relative Strength Index) reads 63.55, above the neutral 50 mark and showing solid upside momentum without being overbought yet.
The $EMA (Exponential Moving Average) cluster now sits below the current price, with the EMA 20 at $4,291.02 and the EMA 50 at $4,223.17, both acting as support below the current consolidation.
The most important thing is that the price holds the current support. If it breaks below this level, the bullish momentum could fade.
The trend remains bullish as long as the price continues trading above the EMAs.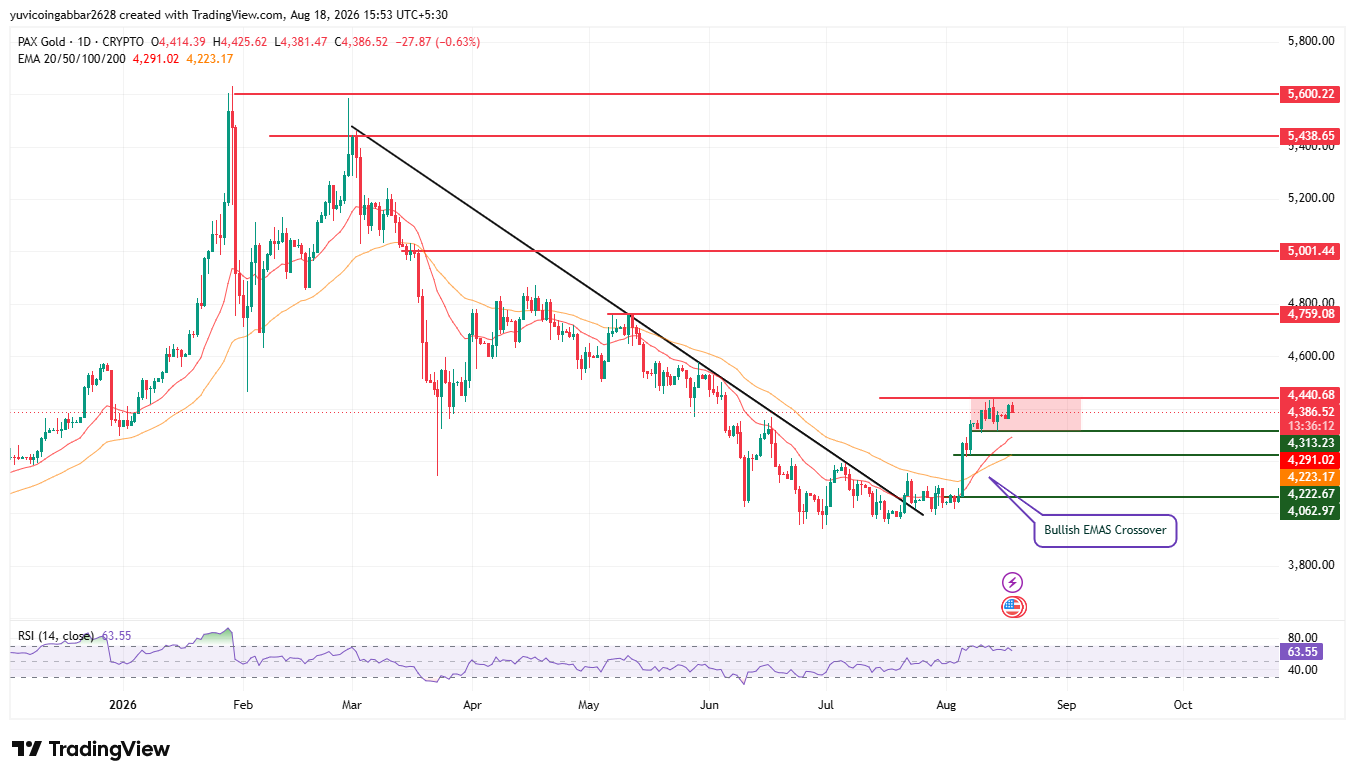
PAXG Price Prediction: Long Term Important Levels
Level Type | Price |
Resistance 5 | $5,600.22 |
Resistance 4 | $5,438.65 |
Resistance 3 | $5,001.44 |
Resistance 2 | $4,759.08 |
Resistance 1 (nearest) | $4,440.68 |
Immediate Price Reference | $4,386.52 |
First Support | $4,313.23 |
Deeper Support | $4,222.67 |
Structural Floor | $4,062.97 |
EMA Levels
EMA | Price |
EMA 20 | $4,291.02 |
EMA 50 | $4,223.17 |
PAX Gold Forecast 2026: Bull Case vs Bear Case
PAXG Price Target 2026 Bull Case: Holding above the first confirmed support at $4,313.23 and the EMA 20 at $4,291.02 keeps the bullish crossover structure intact.
A confirmed move above the nearest resistance at $4,440.68 would open the path toward $4,759.08 and eventually $5,001.44.
PAXG Price Target 2026 Bear Case: A break below $4,313.23 would put the recent crossover in question and bring the EMA 50 at $4,223.17 into play as the next test.
Losing the deeper support at $4,222.67 and the structural floor at $4,062.97 would undermine the bullish structure entirely and point back toward the February to July downtrend.
Price Scenarios 2026: Triggers and Invalidation
Scenario | Trigger | Likely Outcome | Invalidation Point |
Consolidation breakout | Close above $4,440.68 | The path opens toward $4,759.08 and $5,001.44 | Rejection back below $4,386.52 |
Consolidation hold | Price stays between $4,313.23 and $4,440.68 | Range-bound trading continues. | Close below $4,313.23 |
Support breakdown | Close below $4,313.23 | Drop toward the $EMA 50 at $4,223.17, then $4,062.97 | Reclaim of $4,313.23 |
PAXG Price Target 2030: Can PAXG Reach $5,600.22?
$5,600.22 is the highest resistance level marked on the chart.
Reaching it would require PAXG to first clear the consolidation zone above $4,440.68, then break and hold above $4,759.08, $5,001.44, and $5,438.65 in sequence, a multi-stage, multi-month move rather than anything the current daily chart can confirm on its own.
What Could Invalidate the Bullish Setup?
A rejection at the top of the consolidation zone near $4,440.68 followed by a close back below the first confirmed support at $4,313.23 would put the bullish crossover in question.
A deeper break below the EMA 50 at $4,223.17 and the structural floor at $4,062.97 would undermine the setup entirely and reopen the prior downtrend.
PAX Gold Long-Term Price Prediction: 2026-2030
Year | Minimum Price | Average Price | Maximum Price |
2026 | $4,313.23 | $4,600.00 | $5,001.44 |
2027 | $4,759.08 | $5,100.00 | $5,438.65 |
2028 | $5,001.44 | $5,450.00 | $5,600.22 |
2029 | $5,438.65 | $5,900.00 | $6,300.00 |
2030 | $5,600.22 | $6,300.00 | $6,900.00 |
The 2026 to 2028 range is anchored to the resistance levels actually marked on the current chart.
Note: The 2029 and 2030 figures extend beyond any level visible on this chart and assume PAXG continues tracking a moderate long-term uptrend in gold prices; treat these two years as directional estimates rather than technical targets, since no chart data supports them directly.
PAX Gold Price Prediction: Expert Analysis
According to CoinGabbar analysts, PAXG's bullish EMA crossover in early August lines up with the break above a trendline that had capped every rally since February, and RSI at 63.55 backs up that shift without flashing overbought yet.
The $4,313.23 to $4,440.68 range is the level to watch first: holding it keeps the setup constructive, while losing it would call the crossover into question well before any of the longer-term targets come into play.
Disclaimer: This piece is for informational purposes only and isn't financial advice. The levels and scenarios above are based on technical chart analysis and publicly available data at the time of writing, and crypto markets can move sharply within hours, so past patterns don't guarantee future outcomes. It's worth doing independent research and considering your own risk tolerance before acting on any of the levels discussed here.







.webp)








