Bitcoin Price Prediction: Real Rally or Leverage-Fueled Trap


Bitcoin price is back in the spotlight this week. The coin climbed to a five-week high above $66,600, gaining about 13% over the past three weeks. That move has put a key price level back on traders' radars.
The level to watch is $69,340. This is where Bitcoin has failed to break through several times since November.
Analysts call this the Short-Term Holder Realized Price. It marks the average cost basis for people who bought BTC recently.
What is the Bitcoin resistance level right now?
Every time Bitcoin has tried to rally past this line since last November, sellers have stepped in. Chart data shared by on-chain analyst Ali Charts shows the pattern clearly. Each rebound got rejected right around this zone.
If the price closes above $69,340 and holds there, it would break a pattern that has held for months. If it fails again, the coin could slip back toward recent lows.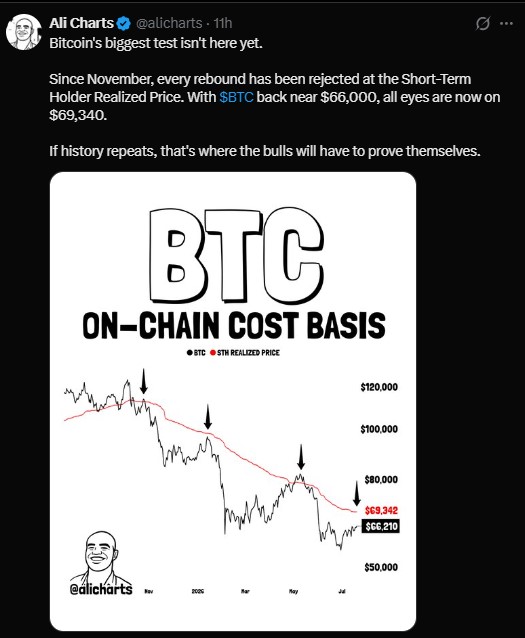
Is Bitcoin's price rally real or driven by leverage?
Not everyone is convinced the current bounce is healthy. Crypto Patel, a popular on-chain commentator, pointed out some warning signs.
Spot trading volume has been cooling since April. At the same time, open interest in Bitcoin futures hit a new high near $23 billion. That is a sign traders are using borrowed money, not real cash, to push prices up.
Stablecoin flows have also been leaving exchanges rather than sitting ready to buy. Meanwhile, spot BTC ETF inflows added just $271 million, which is a trickle compared to past surges.
A rally without spot buyers behind it can unwind fast once momentum slows. That is the caution some traders are raising right now.
Are Bitcoin holders selling or holding right now?
Not all the news is bearish. A separate breakdown of Bitcoin's UTXO age bands tells a different story.
Coins held for six to twelve months are expanding sharply. The three-to six-month group is elevated too. And there is no spike in selling from the newest coin holders.
This pattern suggests coins are moving into stronger hands over time rather than being dumped. Some analysts call this redistribution instead of capitulation.
In simple terms, long-term holders are not panicking, even as headlines stay negative.
What is the Bitcoin price prediction for 2026?
One chart making the rounds points to a longer-term setup. A weekly bullish divergence has formed on Bitcoin's chart, a pattern last seen around November 2022.
The last time this exact setup appeared, the coin rallied more than 100% over roughly 150 days. Some traders are watching to see if a similar move could unfold, with talk of Bitcoin reaching levels near $116,000 before November 2026.
It is worth being careful here. Past patterns do not guarantee future results, and markets can behave differently each cycle.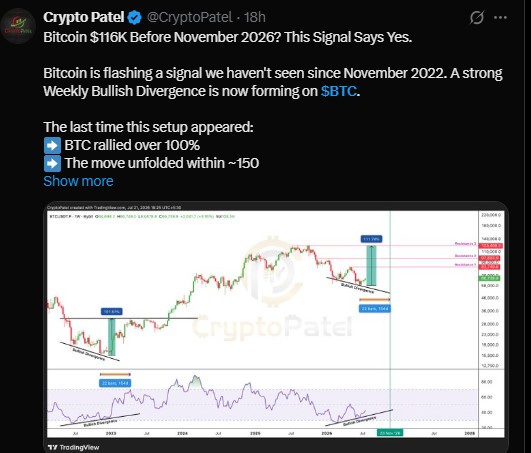
Is Bitcoin outperforming the stock market right now?
Data from Santiment Intelligence shows Bitcoin has started closing a performance gap with traditional markets. While the S&P 500 mostly moved sideways and gold barely moved, $BTC jumped 13% in three weeks.
Softer inflation data and cooling fears around Federal Reserve policy have helped risk appetite return. Spot BTC ETF inflows also started coming back after a rough stretch through May and June.
Nearly 1 million ETH, worth close to $2 billion, has also left exchanges over the past month. Falling exchange balances usually point to less selling pressure, which some see as a bullish sign for Ethereum too.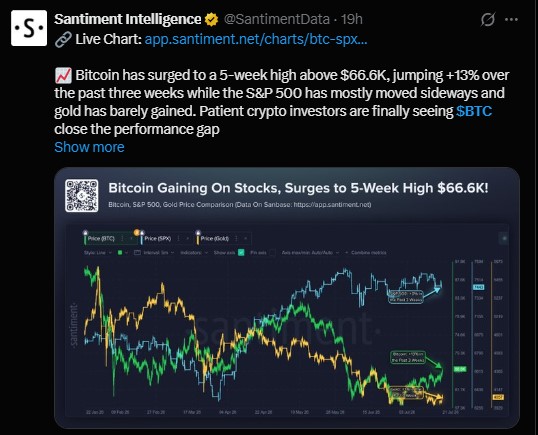
Quick snapshot
Metric | Data Point | What It Suggests |
Current BTC Price | ~$66,600 | 5-week high |
Key Resistance | $69,340 | Rejected multiple times since November |
Open Interest | $23B (new high) | Heavy leverage in the market |
ETF Inflows | $271M | Modest, not a flood |
6-12 Month Holder Cohort | Expanding sharply | Long-term conviction |
ETH Exchange Outflows | ~1M ETH (~$2B) | Reduced sell-side pressure |
3-Week BTC Performance | +13% | Outpacing S&P 500 and gold |
Will Bitcoin price go up or down next?
BTC sits at a fork in the road. A clean break above $69,340 with real spot buying could open the door to a stronger move higher. A rejection at that level, especially with leverage this high, could bring a sharper pullback.
The on-chain holder data offers some reassurance that long-term investors are not rushing for the exit. But the gap between futures activity and spot demand is a real risk worth watching.
For now, traders seem split between chasing momentum and waiting for confirmation that real money, not just leverage, is driving the move.
Disclaimer
This article is for informational purposes only and does not constitute financial, investment, or trading advice. Cryptocurrency markets are highly volatile and speculative. Always conduct your own research and consult a licensed financial advisor before making any investment decisions. Past performance and chart patterns are not guarantees of future results.
Also read:
















