Lorenzo Protocol Price Prediction: Can BANK Hold This Explosive Rally?


BANK just did something most tokens do not do in a single day: it more than doubled. Traders who were not watching this one closely are suddenly paying attention, and for good reason.
What Market Data Shows About the BANK Price Surge
Lorenzo Protocol price prediction has turned heads this week, and the token is now sitting near its all-time high. That alone tells you something is different about today compared to the last few months of quiet trading.
Turns out, this was not a slow grind higher. $BANK jumped over 100% in 24 hours, and volume followed the price almost tick for tick. Basically, when volume confirms a move like this, traders tend to take it seriously instead of writing it off as a fluke.
Here's the thing: big single-day moves usually attract two kinds of traders. One group chases the breakout hoping for more upside, similar to how traders reacted during recent altcoin market trends. The other group waits for a pullback, assuming a move this fast has to cool off eventually. Which group is right this time?
Is this the start of a longer trend or a sharp spike that fades just as fast as it came? That's the question every BANK holder is asking right now.
No single confirmed fundamental catalyst was identified in the sources reviewed. The rally coincided with higher reported volume, a technical breakout, and substantial short liquidations, but these factors do not establish what initiated the move.
Key Takeaways
-
Direction: Bullish structure intact, price trading inside an ascending channel on multiple timeframes
-
Reason: A sharp volume-driven rally pushed BANK up more than 100% in 24 hours, near its all-time high
-
Short-term range: Roughly $0.19 to $0.32 depending on how the channel plays out
-
Invalidation: A close below $0.145868 would break the current bullish structure
Lorenzo Protocol BANK At a Glance: Key Numbers Today
| Field | Data |
|---|---|
| Coin Name | Lorenzo Protocol |
| Ticker Symbol | BANK |
| Blockchain | BNB Smart Chain (BEP-20) |
| Today High | $0.257667 |
| Today Low | $0.095775 |
| RSI Level | 75.11 (1H) |
| Token Type | Governance token |
| Token Category | DeFi |
| Contract Address | 0x3AeE7602b612de36088F3ffEd8c8f10E86EbF2bF |
| Market Cap | $184.83M |
| 24H Trading Volume | $417.26M |
| 24H Volume Change | +227.81% |
| Circulating Supply | 764.94M BANK |
| 24H Change | +115.96% |
Source: Data by CoinMarketCap
What Is Lorenzo Protocol and Why It Exists
The Lorenzo Protocol is a DeFi project built on the BNB Smart Chain, and BANK is its governance token, part of a wider wave of activity across blockchain crypto news this year. The project focuses on yield strategies, letting holders take part in decisions around how the protocol develops and how rewards get distributed.
BANK Price History: From Cents to a Fresh High
BANK has come a long way from its 52-week low near $0.01839, recorded back in April 2025. As per CoinMarketCap, the token just touched a fresh all-time high of $0.2522, a level it had never closed above before today.
That kind of move, from under two cents to over 25 cents, is a large percentage gain for a mid-cap token, though no specific catalyst behind the move has been confirmed.
Source: Data by CoinMarketCap
Why Lorenzo Protocol Is Getting Attention Right Now
According to BscScan , BANK now has more than 58,000 token holders on-chain, and transfer activity has crossed 15.2 million transactions in total. That is not a dead chart with a few bots pushing candles around; real wallets are moving.
The token trades across major top exchanges, including Binance, Bybit, Bitget, and Gate, which gives it liquidity depth that smaller altcoins simply do not have. Wide exchange access tends to matter a lot when a token is moving this fast, because it lets larger holders enter and exit without wrecking the order book.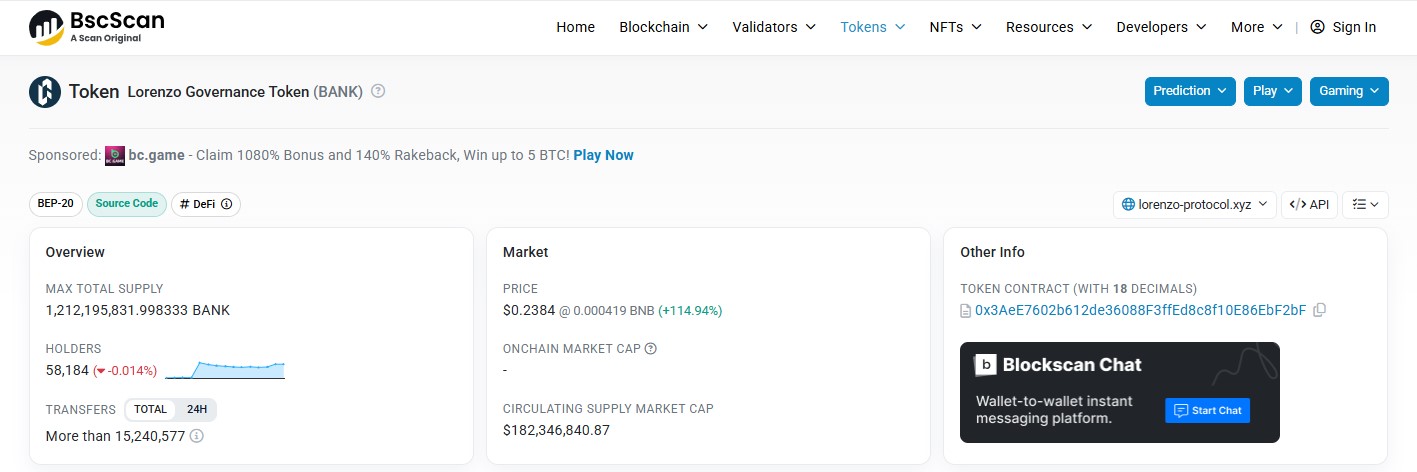
Source: BscScan
Lorenzo Protocol Liquidation Data: Who Got Caught Out
As per CoinGlass , the last 24 hours were rough for short sellers. Total liquidations hit $13.20M, with $9.83M of that coming from short positions getting squeezed as the price ripped higher. Longs were not spared either, losing $3.37M over the same period.
Zoom into the last hour and it's a smaller but similar story: $87.45K in short liquidations against $80.32K in longs. The four-hour window shows an even bigger short side wipeout at $1.86M.
Source: Liquidation data by CoinGlass
Fundamental Analysis: Concentration Is the Real Risk Here
This is where the picture gets less exciting. According to on-chain analytics, the top 100 BANK holders control 99.48% of supply, and whale wallets alone account for 96.49% of market cap despite making up just 0.07% of all holders. The single largest wallet holds close to 37% of total supply on its own.
That level of concentration means price can be moved hard in either direction by a small number of large holders, a pattern worth comparing against broader crypto price predictions and coverage. It does not make the token fake, but it does mean retail traders are playing in a pool where a few players hold most of the water.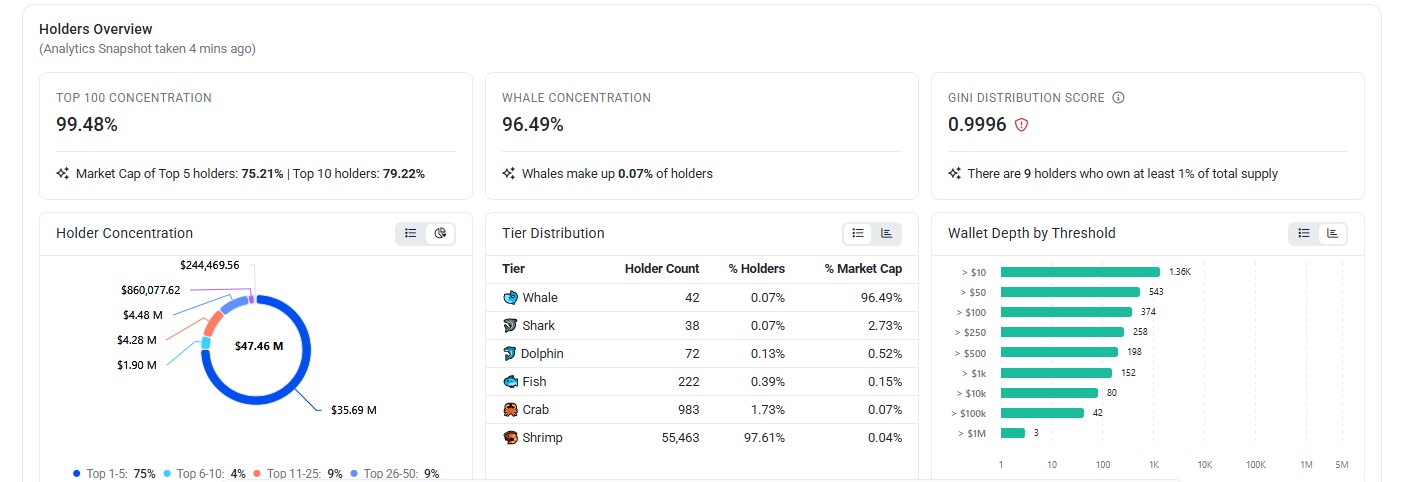
Source: On-chain holder analytics
Lorenzo Protocol Technical Analysis: BANK Rides the Channel Higher
The rally started on volume, and that's the part chart readers cannot ignore. According to TradingView chart analysis, price broke out of a multi-day base and has been climbing inside a clean ascending channel on the hourly.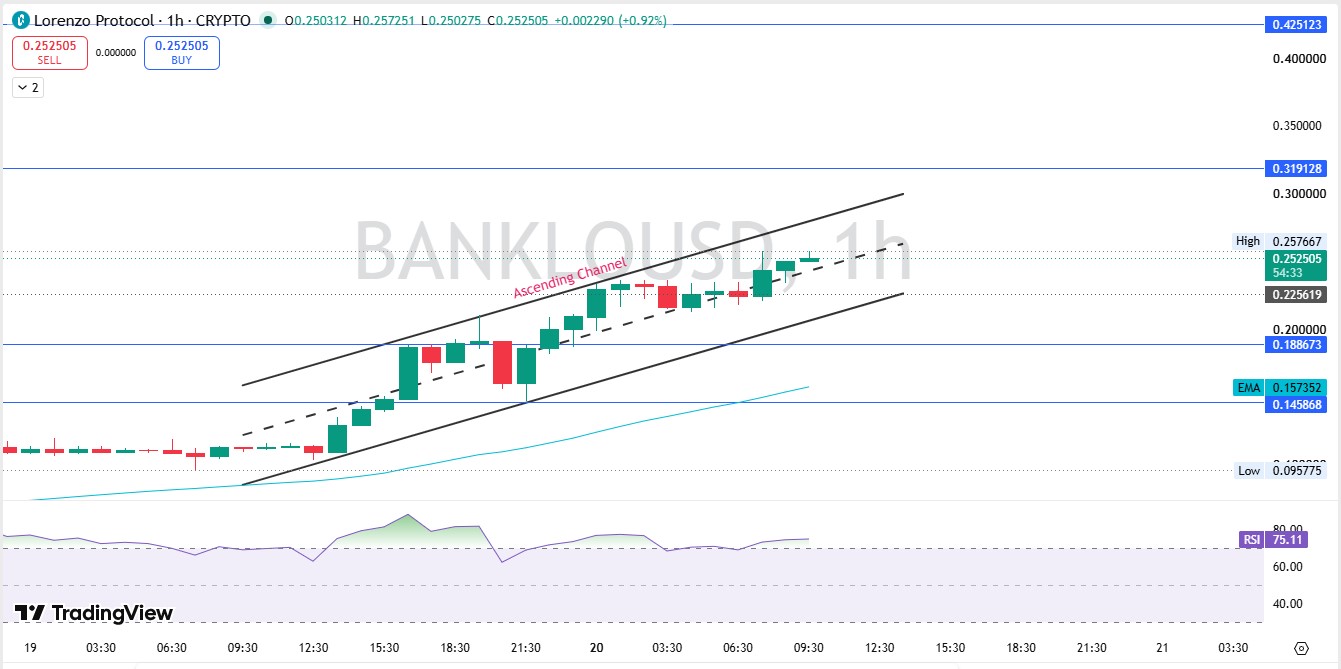
Price sits above the hourly 50 EMA, which reads $0.157352 against a current price of $0.252505. Buyers are clearly in control on this timeframe, though EMA data for other timeframes was not provided in the sources reviewed.
RSI is sitting at 75.11 on the hourly chart, deep into overbought territory. That does not mean a crash is coming, but it does mean the move is stretched and prone to sharp pullbacks even inside an uptrend.
First support/pivot: $0.209614 (the level closest to the current price of $0.252505). Secondary support: $0.188673. Structural invalidation: $0.145868 — a close below this level breaks the ascending channel.
Lorenzo Protocol Volume Heatmap: Where the Trading Is Happening
According to CoinGlass , LBank is currently the busiest venue for BANK spot volume at $3.02B, followed by Binance at $1.72B. Bybit, Bitget, Bitunix, Gate, and MEXC round out the rest of the top venues, each processing tens to hundreds of millions in volume.
Source: Volume heatmap by CoinGlass
BANK's Move in the Context of Broader Crypto Markets
Most DeFi governance tokens do not put up a 24-hour gain anywhere close to what BANK just posted. Plenty of names have moved sideways for weeks while BANK broke away from the pack. BANK recorded unusually high reported trading activity relative to its market capitalization. Reported volume alone does not establish organic demand or rule out liquidity and market-structure risks such as wash trading, thin order-book depth, or concentrated market-making.
This section does not compare BANK against other DeFi governance tokens directly; it references broader market coverage (Bitcoin and Solana) for context only. The token is still a small cap compared to majors like Bitcoin or fast-moving large caps like Solana, so volatility in both directions should be expected. A direct comparison against comparable DeFi governance tokens was not available in the sources reviewed.
BANK Short-Term Price Outlook: Next Few Days to a Week
The short-term picture stays bullish as long as BANK holds above its base support. A pullback toward the mid-channel would not break the trend, but losing the base support zone would change the setup fast.
| Timeframe | Bearish Level | Bearish Target | Pivot / Base Level | Base Target | Bullish Level | Bullish Target | Invalidation |
|---|---|---|---|---|---|---|---|
| 24 Hours | Key Support | $0.239699 | $0.225619 | Intraday High Reclaim | $0.257667 | $0.257667 | Break below $0.225619 |
| 3-7 Days | Lower Support | $0.209614 | $0.188673 | Key Pivot Zone | $0.239699 | $0.257667 | Lose $0.209614 |
| 2-4 Weeks | Major Support | $0.188673 | $0.145868 | Key Resistance | $0.319128 | $0.326647 | Weekly close below $0.145868 |
Source: TradingView (4H) | Traditional Pivot Points | EMA 50 | Market Structure
— note: current spot $0.252505 sits between the $0.239699 support and $0.272902 resistance, so the 24H setup is genuinely a coin-flip zone right now, not a clean breakout.
BANK Long-Term Price Outlook: Months Ahead
Longer term, BANK needs sustained volume and holder growth to justify holding above current levels, since a single-day spike alone rarely survives months without follow-through demand, the same test that shapes broader Bitcoin Ethereum price prediction narratives when capital rotates between majors and smaller caps.
| Timeframe | Bearish Level | Bearish Target | Base Level | Base Target | Bullish Level | Bullish Target | Catalyst Needed |
|---|---|---|---|---|---|---|---|
| 3 Months | Weekly Support | $0.181500 | $0.157352 | Weekly Pivot Zone | $0.231732 | $0.2522 | Weekly R3 |
| 6 Months | Range Low | $0.15 | $0.08 | Key Resistance Zone | $0.32 | $0.43 | Major Resistance |
| End of Year | Macro Support | $0.10 | $0.06 | Major Resistance | $0.43 | $0.55 | Major Breakout Zone |
| 2027 Outlook | Macro Support | $0.08 | $0.05 | Major Resistance | $0.60 | $0.80 | New ATH Extension |
Source: TradingView (Weekly) | Traditional Pivot Points | Macro Trend Analysis
The long-term case is not weak, but it is not proven yet either. It rests heavily on this rally turning into real sustained demand instead of a one-off spike.
Three BANK Price Scenarios Traders Should Prepare For
Worst Case: Whale wallets start distributing into the rally, price loses $0.145868, and the channel breaks down. That would open a retest of the $0.09 to $0.10 zone.
Base Case: BANK consolidates between $0.19 and $0.32 for a few weeks, letting the RSI cool off before any real attempt at new highs.
Best Case: Volume holds up, price clears $0.319128 with strength, and BANK pushes toward $0.425123 as new buyers pile in behind the breakout.
| Scenario | Price Range | What Triggers It |
|---|---|---|
| Worst Case | $0.09 - $0.145 | Whale selling, channel breakdown, RSI unwind |
| Base Case | $0.19 - $0.32 | Sideways consolidation, RSI cooling |
| Best Case | $0.32 - $0.43 | Volume-backed breakout above resistance |
Key Price Levels to Watch on the BANK Chart
Resistance zone: $0.319128, then $0.425123. These mark the R2 and R3 pivot levels above the current price and are the next real test for bulls.
Support zone: $0.188673 is the immediate floor, with $0.209614 acting as a base pivot just below the current price.
Invalidation zone: $0.145868. A confirmed close under this level would break the ascending channel and shift the outlook toward further downside.
Analyst View and Final Thoughts on Lorenzo Protocol
The chart setup right now favors buyers, plain and simple. The price is above the hourly 50 EMA, and the ascending channel has not been broken once during this run.
RSI at 75.11 is a caution flag, though. It does not mean sell everything, but it does mean chasing the top of this candle is riskier than buying a pullback.
A weekly close above $0.209614 would confirm the base support is holding and give the bullish case real weight going into next week. Below it, the story changes fast.
One thing worth tracking beyond the chart: whale concentration, alongside broader risk appetite across the Ethereum ecosystem that tends to spill into smaller DeFi names like this one. With under a tenth of a percent of holders controlling nearly all the market cap, a coordinated exit could hit the price far harder than normal profit-taking would on a more distributed token.
The most important level on the board stays $0.145868. Hold it and the trend lives on. Lose it and this becomes a very different conversation.
Fast moves get fast reversals. Manage size accordingly.
Risk Factors Traders Should Not Ignore
-
Liquidity risk: heavy reliance on a handful of exchanges and a small number of whale wallets means slippage can spike fast in either direction.
-
Volatility risk: RSI near 75 on the hourly chart signals an overextended move that can correct sharply without warning.
-
What breaks the thesis: a daily or weekly close below $0.145868 invalidates the current bullish channel structure.
Disclaimer
This article is for educational purposes only and does not constitute financial advice. Crypto markets are volatile. Consult your investment advisor before making any investment decision.

















