NEAR Protocol Price Prediction: A Quiet Layer-1 Ready to Surprise


Nobody was paying attention to NEAR last month. Then something shifted : quietly, at the edges, the kind of move that only makes sense after you've already missed it.
Traders who caught it early aren't talking much. But the chart is starting to say something loud. NEAR Protocol price prediction is now trading around $2.727, up roughly 16.8% in the last 24 hours alone, and the daily structure that's been building for weeks is finally starting to crack open.
What's driving it?
A combination of Bitcoin holding strength above key levels, whale accumulation that started before most retail traders noticed, and a broader altcoin rotation that's putting Layer-1 projects back on screens.
And 2026 specifically matters for NEAR Protocol Price Prediction: this is the year that ascending channel either delivers its breakout or breaks down and resets everything. Before you decide which side you're on, here's what the data is actually showing.
The Quiet Setup Most Traders Missed
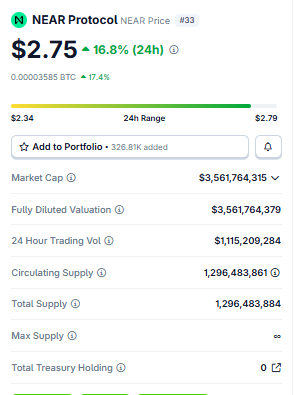
Source: Data by coingecko
NEAR Protocol price $2.75 market cap $3.56 million 24 hour trading volume 2026
NEAR Protocol Price Prediction: current price is sitting around $2.75, with the 24-hour range stretching from $2.34 to $2.79. That's a $0.45 intraday swing : not a small number for a coin at this price.
The 24-hour trading volume has crossed $1.11 billion, which tells you this isn't just noise. Circulating supply stands at approximately 1.296 billion tokens and the total supply matches that almost exactly.
Market cap is around $3.56 million. Honestly?
For a Layer-1 chain with NEAR's fundamentals and developer activity, that number feels compressed. And compressed market caps in altcoin season tend not to stay compressed for long.
Reading the Chart Before the Next Move
NEAR Protocol USDT 1 hour is making an ascending channel supported by the EMAs cluster of 20, 50, and 100. The RSI is 66.67, suggesting more upside, as the RSI is not overbought.
When we pulled up the 1-hour NEAR/USDT chart on Binance, the first thing that stood out was the ascending channel structure.
Price has been making higher lows and higher highs in a clean, well-defined channel. All three EMAs, the 20, 50, and 100, are stacked below price in bullish order. That's not a coincidence. That's trend confirmation.
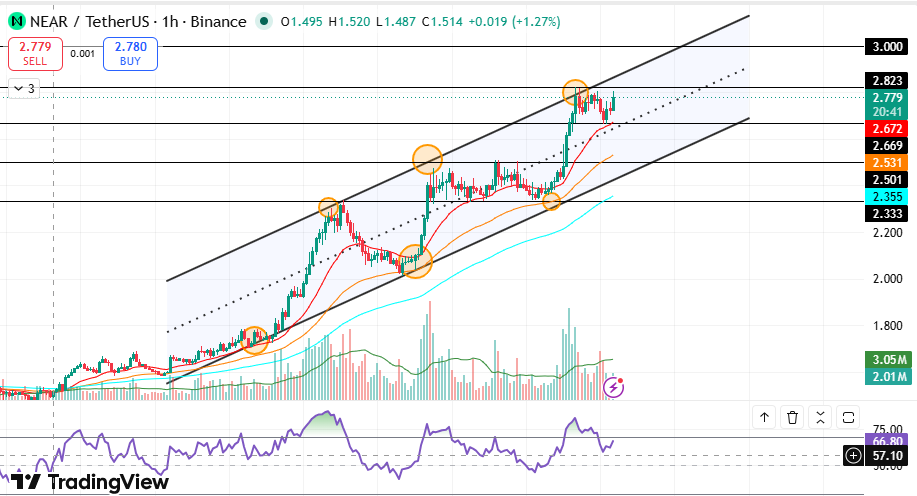
RSI is sitting at 66.67 : that's elevated but not yet overbought. There's still a window before the 70 ceiling closes in. Last time RSI hit this zone in this channel, price followed through to channel resistance. The chart doesn't lie.
Entry zone for anyone watching this setup sits approximately in the $2.50 to $2.67 range on any pullback, especially if the channel midline holds. Short-term target : $2.823 resistance, then the psychological zone of $3.00.
If price breaks above $2.823 cleanly and closes there on the 1-hour, the $3.00 level comes into play fast. if price breaks below $2.355 and closes there, the immediate setup is invalidated.
Honestly? The technical setup here is more structured than most setups you'll see in the current altcoin cycle.
Why Bulls Are Still Holding On
The bullish factors here aren't manufactured. They're showing up in the chart, the volume, and the social data at the same time, which is usually when setups get real.
Downtrend broken on the daily timeframe, with accumulation zone cleared : that's not a minor signal.
Bitcoin is holding strength, and when BTC stabilizes, capital rotates into quality Layer-1 alts. NEAR Protocol Price Prediction tends to be on that rotation list.
24-hour volume of $1.11 billion at a price under $3 shows this is institutional-grade interest, not retail speculation.
RSI on the 1-hour chart is at 66.67 : approaching overbought territory but not there yet, still has room to push before hitting the 70-75 ceiling.
All three EMAs (20, 50, and 100) are positioned below the current price, meaning trend structure is bullish across multiple time windows.
What's Keeping a Lid on the Price
We won't lie : the resistance structure here deserves real respect.
$2.823 is the immediate ceiling. That's the top of the ascending channel on the 1-hour chart. Price has touched it, pulled back already.
The $3.00 psychological level above that is not a technical resistance. It's a crowd psychology wall. Everyone's got orders sitting there.
If $2.672 breaks and price closes below it on the 1-hour, the next support area drops to approximately $2.501 to $2.531.
Broader crypto markets can shift fast. Any Bitcoin weakness below $74k tends to trigger quick unwinding in smaller caps.
The 16.8% single-day move has already pulled in some quick-profit sellers. Retest risk is real.
Key Zones to Watch This Month
The key levels you need on your screen right now :
Immediate resistance : $2.823 (ascending channel top)
Psychological resistance : $3.00
Current price zone : approximately $2.77 to $2.78
First support : $2.672 (channel midline area)
Next support if that breaks : approximately $2.501 to $2.531
Channel base support : approximately $2.333 to $2.355
Best Case Scenario for 2026
NEAR Protocol price prediction for 2026 carries a few possible scenarios, and the honest answer is that the chart supports the bullish case more than it supports the bearish one right now.
If Bitcoin continues its current trend and NEAR breaks above $3.00 cleanly with volume confirmation, a retest of the $4.00 to $4.50 range becomes the next realistic target.
That's approximately 55-65% from current price. Not a moon call. A structured move.
If broader market conditions deteriorate, or if NEAR Protocol Price Prediction fails at $2.816 multiple times without follow-through, the downside scenario brings it back toward $2.00 to $2.20 for a deeper accumulation phase before any next leg up.
The Longer Game : 2027 and Beyond
NEAR Protocol Price Prediction monthly chart multi year downtrend line breakout level 4.50 all time high 20 dollar macro setup 2026
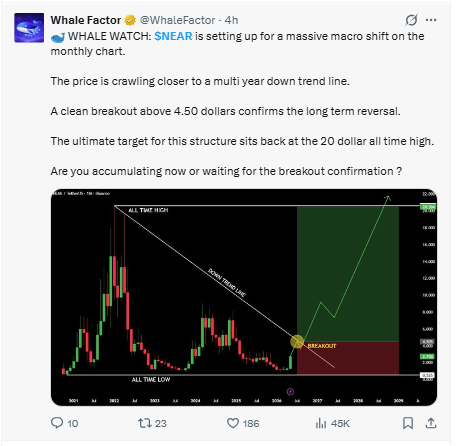
Whale Factor flagged this on the monthly chart : NEAR is crawling closer to a multi-year downtrend line on the macro timeframe.
A clean confirmed breakout above approximately $4.50 would flip the long-term structure from bearish to bullish.
If that happens : and that's a real if, not a certainty : the target structure on the monthly chart puts the previous all-time high of approximately $20 back into play.
That's a multi-year trade, not a swing. But the structure is setting up. Whether 2026 is the year it triggers, or 2027, depends heavily on where Bitcoin goes and how much capital rotates into Layer-1 ecosystems. Smart money is already accumulating below $3.
Final Word : Worth the Risk in 2026?
NEAR Protocol price prediction for 2026 isn't a simple bull or bear call. It's a conditional one. The structure is bullish.
The momentum is real. The whale accumulation signal is clear. But the resistance at $2.823 and $3.00 is equally real, and anyone walking in expecting a straight line up is going to get tested.
If you're watching NEAR Protocol Price Prediction in 2026, the zone to focus on is the $2.50 to $2.67 range for entries on any pullback. The zone to respect as resistance is $2.823.
And the zone that would genuinely change the long-term story is a confirmed close above $4.50 on the monthly chart.
Is NEAR Protocol a good investment in 2026?
Based on current technicals and momentum : yes, with managed risk and realistic targets. But the market hasn't given final confirmation yet. And that's exactly the problem.
DISCLAIMER: This article is for educational purposes only and does not constitute financial advice. Crypto markets are highly volatile. Before making any investment decisions, consult your investment advisor.

















