Nockchain Price Prediction: What Is Behind Today's Sudden NOCK Jump?


Nockchain price prediction is on every trader's mind right now because NOCK just did something it has not done in weeks: it moved. Fast, and in one direction. A coin that had been grinding lower inside a tight channel for days suddenly woke up, and that kind of move always gets attention.
There is a reason a price does not just wake up on its own. Something usually shifts first, either in sentiment, in positioning, or in how sellers are running out of ammunition.
That is exactly the kind of setup NOCK is showing right now. Buyers stepped in where sellers had been winning for over a week, and the reaction was sharp.
So is this the start of something bigger, or just a relief bounce before sellers come back? That is the question worth sitting with for a second.
Turns out the answer is a little more complicated than a simple yes or no, and the chart, the holder data, and the broader setup all tell slightly different parts of the story.
Why Nockchain Coin Is Suddenly The Most Talked About ZK Token
Nockchain price prediction discussions have picked up because NOCK has been one of the sharpest movers in the small-cap zero-knowledge sector over the past day, at a time when altcoin market trends have been mixed at best. Basically, a coin that was fading quietly just forced its way back into the conversation.
Here's the thing: most small-cap tokens do not get this kind of reaction without either a change in trader sentiment or a shift in how the chart was structured going in.
We pulled up the 4-hour chart, and the first thing that stood out was how far price had extended above its own short-term average in a single session. That is not something you see on a quiet day?
Nockchain Coin Overview: Price, Supply, and Basic Token Data Today
| Metric | Value |
|---|---|
| Coin Name | Nockchain |
| Ticker Symbol | NOCK |
| Blockchain | Nockchain Layer 1 (Zero-Knowledge Proof-of-Work) |
| Today High | $0.024369 |
| Today Low | $0.018437 |
| RSI Level (4H) | 67.88 |
| Token Type | Proof-of-Work (PoW), ZK Compute Native Asset |
| Token Category | Zero-Knowledge (ZK) / Proof-of-Useful-Work |
| Market Cap | $49.63M |
| 24H Trading Volume | $1.06M |
| 24H Trading Volume Change | +25.47% |
| Circulating Supply | 2.22B NOCK |
| 24H Change | +27.37% |
Source: Data by CoinMarketCap
What Exactly Is Nockchain, and Why Did It Launch In 2025?
Nockchain is not a typical smart contract chain; it is a layer 1 built around zero-knowledge proofs instead of plain hash mining. Miners generate ZK proofs of useful computation rather than burning power on arbitrary puzzles.
It launched in May 2025 with no pre-mine and a hard cap of roughly 4.29 billion NOCK, and that fair launch story is part of why the community still talks about it as a Bitcoin-style project with a modern twist, even as Bitcoin price outlook debates keep shaping overall risk appetite.
Why This Coin Matters Now Beyond Just The Green Candle
The project's pitch is proof-of-useful-work, meaning the same mining effort that secures the chain also produces verifiable computation that apps can actually use. That is a real technical claim, not just marketing.
And there is a fair launch history behind it too. No venture allocation, no foundation treasury sitting on a giant bag, which matters to a certain type of trader who got burned by pre-mined tokens before; and the same skepticism that colors how people read Ethereum price outlook calls today.
Nockchain Holder Concentration: What The On-Chain Data Actually Shows
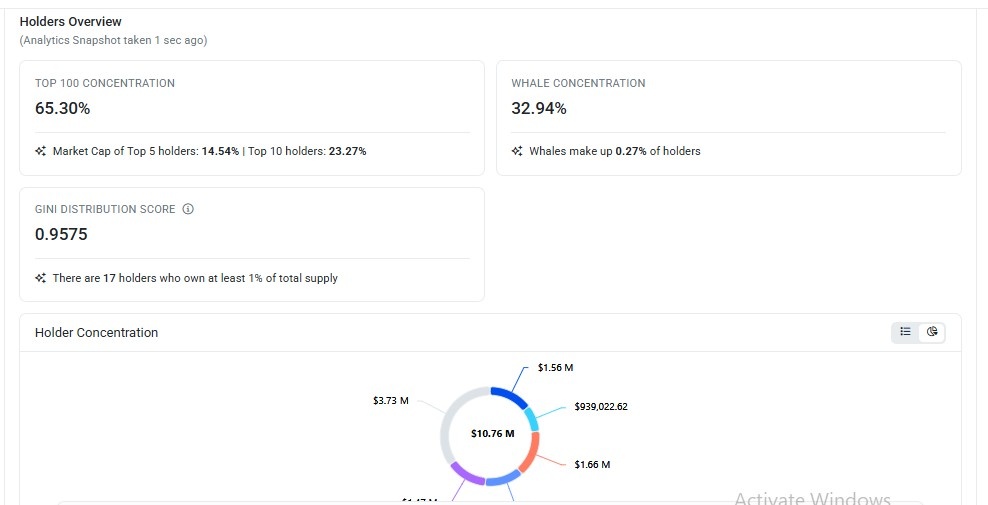
The top 100 wallets hold 65.30% of the supply, and just 18 whale wallets, which is 0.27% of all holders, control 32.94% of the market cap. The Gini score sits at 0.9575, which is high concentration by any measure.
On the other end, over 4,200 wallets classified as shrimp hold barely 0.03% of the supply combined. That is a very top-heavy distribution for a coin still finding its price.
Source: Holder analytics via token holder dashboard
Technical Price Analysis: Reading The Breakout Before The Numbers
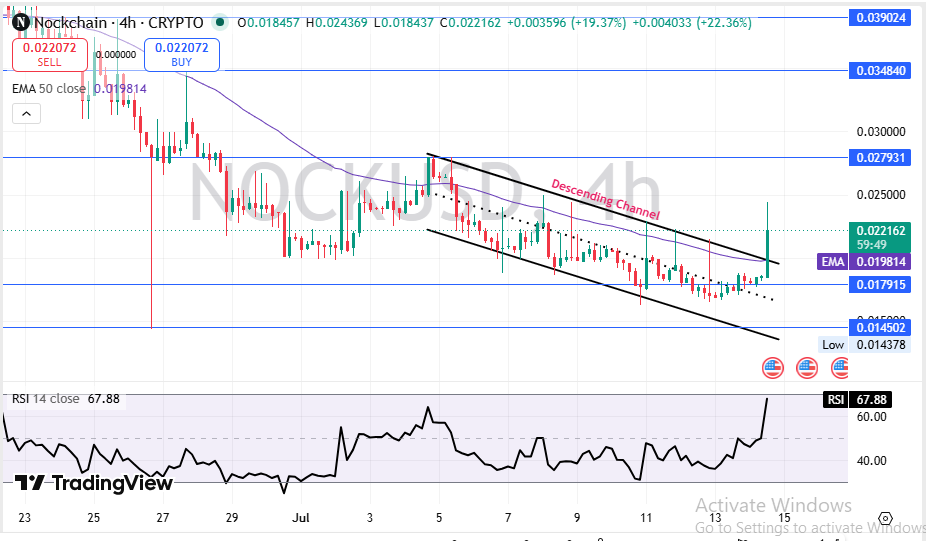
Price did not just drift higher; it broke a defined descending channel that had capped every rally attempt. That is the real story before you even look at RSI.
Source: Charting by TradingView
Buyers pushed the price back above the 50 EMA, which now sits at $0.019814 on the 4-hour chart. Reclaiming a moving average after weeks below it usually shifts short-term control toward buyers.
RSI at 67.88 is elevated but not yet at extreme overbought territory. There is still some room before the indicator starts warning of exhaustion, though it is getting closer.
Immediate resistance sits at $0.027931, with a heavier ceiling at $0.034840.
Support below sits at $0.017915, and a close under $0.014502 would invalidate the current bullish structure entirely.
Nockchain Short-Term Price Prediction: What Traders Should Watch This Week
Momentum favors buyers right now, but $0.027931 is the level that decides whether this turns into a real trend or just a bounce inside a longer downtrend.
| Timeframe | Bearish Target | Base Target | Bullish Target | Key Trigger |
|---|---|---|---|---|
| 24 Hours | $0.019800 | $0.022200 | $0.024400 | Holding above the reclaimed 50 EMA |
| 3–7 Days | $0.017900 | $0.023500 | $0.027900 | Volume follow-through above today's high |
| 2–4 Weeks | $0.014500 | $0.026000 | $0.034800 | Weekly close above channel resistance |
Watch $0.017915 closely. Lose that and the bounce story weakens fast.
Nockchain Long-Term Price Prediction: Where NOCK Could Head Into 2027
The long-term case rests less on this week's candle and more on whether Nockchain's proof-of-useful-work model actually gets adopted by developers building on it.
| Timeframe | Bearish Target | Base Target | Bullish Target | Catalyst Needed |
|---|---|---|---|---|
| 3 Months | $0.012000 | $0.028000 | $0.045000 | Sustained trading volume above the breakout zone |
| 6 Months | $0.009000 | $0.035000 | $0.065000 | Real NockApp usage growth on the mainnet |
| End of Year | $0.008000 | $0.042000 | $0.085000 | Broader ZK-PoW sector rotation |
| 2027 Outlook | $0.006000 | $0.055000 | $0.120000 | Meaningful exchange listings and ecosystem integration growth |
The long-term case is not weak, but it is not proven either. It depends on adoption showing up in real usage, not just chart momentum, especially with memories of the recent crypto market crash still fresh for a lot of traders.
Three Price Scenarios For Nockchain: Worst, Base, and Best Case
Worst Case: Price fails at $0.027931, rolls over, and breaks back below $0.017915. This happens if the bounce was mostly short covering with no fresh demand behind it.
Base Case: Price consolidates between $0.018 and $0.028 for a few weeks while the market decides if the breakout is real. Most range-bound coins behave exactly like this after a sharp move, the same pattern traders have watched play out when Bitcoin to Ethereum capital rotation shifts risk appetite across smaller altcoins.
Best Case: Price clears $0.034840 on strong volume, and the descending channel gets fully invalidated. That needs sustained buying, not just one green day.
| Scenario | Price Range | What Triggers It |
|---|---|---|
| Worst Case | $0.012 - $0.017 | The breakout fails and sellers regain control below key support. |
| Base Case | $0.018 - $0.028 | Sideways consolidation as the market digests the recent move. |
| Best Case | $0.030 - $0.045 | A confirmed channel breakout supported by rising trading volume. |
Key Price Levels To Watch On The Nockchain Chart Right Now
Resistance zone: $0.027931 first, then $0.034840. A close above the first level on strong volume opens the door to the second.
Support zone: $0.017915. This is the line that separates the current bullish structure from a return to the old downtrend.
Invalidation zone: Below $0.014502. A close under this level would signal the breakout has failed completely.
Analyst View And Final Thoughts On Nockchain's Next Move
The chart setup right now favors buyers, but not by a wide margin. A descending channel breakout backed by real volume is the kind of signal that deserves respect, not unlike the setup behind the broader crypto market rally seen across risk assets recently.
RSI at 67.88 gives some room before overbought conditions kick in, though not a lot. A cooling-off period somewhere near current levels would not be surprising.
A weekly close above $0.017915, and ideally above $0.027931, would signal the old downtrend structure is genuinely broken, not just paused.
One thing worth tracking beyond the chart: broader risk sentiment across small-cap altcoins. NOCK does not move in isolation, and a risk-off shift across crypto price predictions more broadly could cap this move regardless of how clean the breakout looks on its own.
The single most important level remains $0.017915. Hold it, and buyers stay in charge. If you lose it, this rally was just noise.
Momentum is real here. Whether it lasts is a different question entirely.
Disclaimer
This article is for educational purposes only and does not constitute financial advice. Crypto markets are volatile. Consult your investment advisor before making any investment decision.

















