GRAM Price Prediction: Telegram Wallet Push GRAM Higher?


GRAM is back in the spotlight after Pavel Durov unveiled plans for a native non-custodial wallet inside Telegram.
The timing is interesting. GRAM is trading around $1.50 after a weak session, and the chart is tightening near an area where buyers have stepped in before.
Traders now have two things to watch: whether the wallet story can bring fresh demand into the market and whether that interest is strong enough to pull GRAM out of its current squeeze.
Why Is the GRAM Price Prediction at a Key Decision Point?
The coinmarketcap data places GRAM (previously Toncoin) near $1.50, down roughly 2.8% over 24 hours.
Its market capitalization is shown near $4.11 billion, with a fully diluted valuation around $7.85 billion. The circulating supply is approximately 2.73 billion GRAM against a total supply of about 5.21 billion.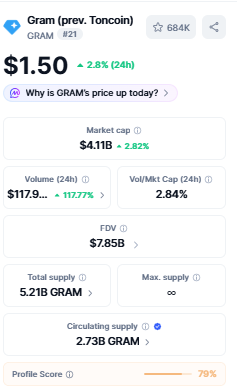
Price is now sitting close to an important support cluster while the daily chart continues to compress beneath a descending trendline.
That creates a straightforward technical test: buyers need to defend the lower range and reclaim the first resistance, while sellers need a clean support breakdown to confirm further weakness.
Market data source: Supplied market snapshot, 22 July 2026. Values may vary across platforms and retrieval times.
Could Telegram’s Native Wallet Rollout Change the GRAM Narrative?
A major fundamental catalyst has entered the discussion after Pavel Durov announced plans to bring a native non-custodial $Gram wallet to Telegram applications.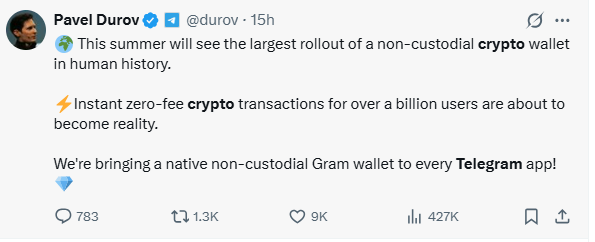
The announcement described instant, zero-fee crypto transactions and positioned the rollout as potentially reaching Telegram’s eormous global user base.
The development can strengthen attention around the GRAM Network ecosystem, but it should not automatically be treated as proof of an immediate price breakout.
Adoption, rollout execution, and actual wallet usage will matter more than the announcement alone.
The chart still requires technical confirmation above resistance before the bullish scenario gains strength.
Catalyst source: Pavel Durov's social media post supplied for this analysis.
What Does the GRAM Daily Chart Show?
The tradingview GRAM/USD daily chart shows price compressing inside a descending triangle after a much larger earlier rally. Immediate resistance is marked around $1.561.
A confirmed close above that level would be the first technical sign that selling pressure is easing as price tried to break it today but failed to break it.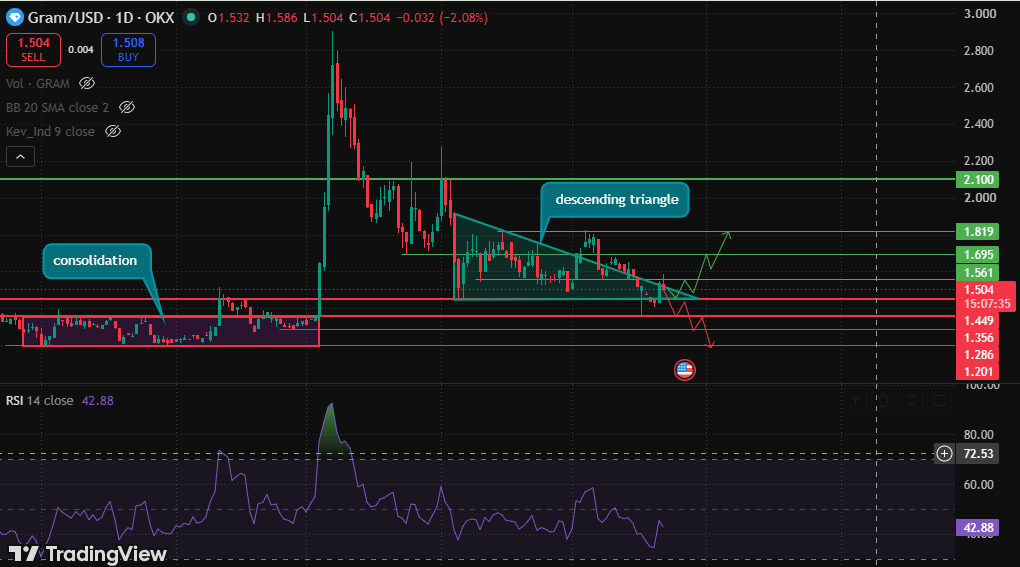
Above $1.561, the next resistance levels sit near $1.695 and $1.819. If buyers eventually clear the broader resistance structure with sustained follow-through, $2.10 becomes the larger upside level to watch.
The bearish path remains equally clear. Support is marked near $1.449, followed by $1.356, $1.286, and $1.201. The chart's RSI is around 42.88, placing momentum below the neutral 50 level without showing a deeply oversold condition.
That supports a cautious interpretation rather than treating the current price as an automatic reversal point.
$GRAM Scenario Map
Scenario | Trigger | Confirmation | Targets | Invalidation |
Bullish | Daily close above $1.561 | Daily hold with follow-through | $1.695 $1.819 $2.10 | Failure back below breakout zone |
Range/Base | $1.449–$1.561 holds | No confirmed break either side | Continued consolidation | Confirmed boundary break |
Bearish | Loss of $1.449 | Sustained daily weakness below support | $1.356 $1.286 $1.201 | Recovery back above lost support |
What Are GRAM Derivatives Traders Signaling?
The derivatives data reveals a notable positioning divergence. Binance’s GRAM/USDT account long/short ratio stands at 0.5242, showing substantially more short accounts than long accounts.
The Binance top-trader account ratio is also below one at 0.6972.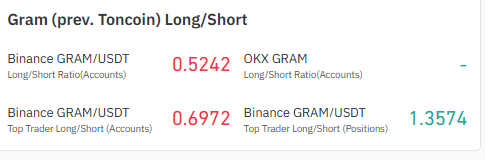
However, the top-trader long/short ratio based on positions stands at 1.3574.
This creates an important distinction: trader accounts are leaning short, while aggregate top-trader position sizing is leaning long.
The divergence on coinglass suggests that the number of bearish accounts does not tell the entire positioning story.
What Do Liquidations and Funding Add to the Setup?
The coinglass liquidation total liquidations of around $351.92K over the past 24 hours, split between roughly $200.19K in longs and $151.72K in shorts.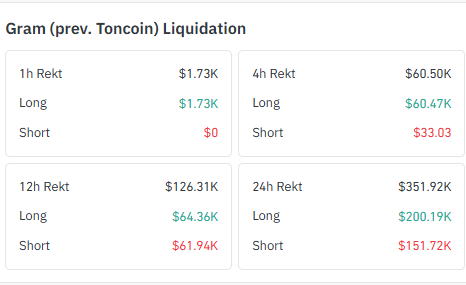 In the latest four-hour window, nearly all of it was about $60.47K out of $60.50K came from long positions, showing that the recent dip hit leveraged bulls hardest.
The OI-weighted funding chart also shows rapidly changing positioning conditions.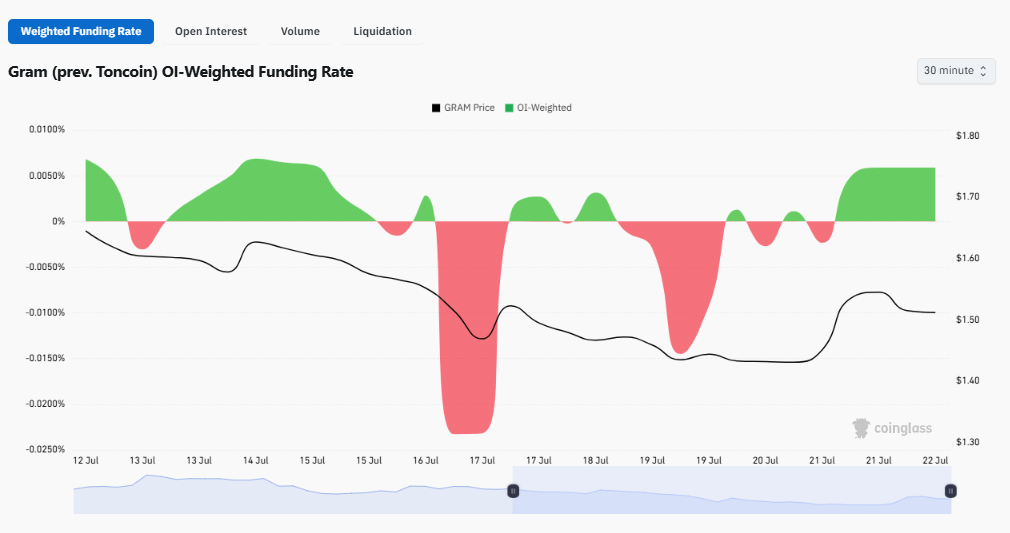
Funding moved through both positive and sharply negative periods during the displayed window before returning to positive territory near the latest reading.
This suggests that leverage sentiment has been unstable rather than consistently positioned in one direction.
Futures activity is concentrated most heavily on Binance in the supplied volume heatmap, at about $49.38 million, followed by Bybit at $37.60 million and OKX at $22.72 million.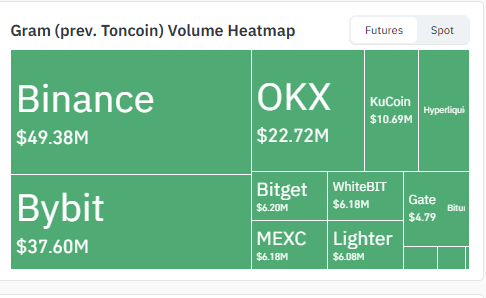
Together, the data points to an active derivatives market in which short-heavy account positioning, long-heavy top-trader position sizing, and recent long liquidations are pulling in different directions.
Derivatives source: CoinGlass data for this analysis, 22 July 2026.
$GRAM Signal Matrix: What Is the Combined Evidence Saying?
Right now the setup is mixed. The price is stuck just below resistance, so it stays neutral to bearish until that breaks.
RSI at 42.88 shows momentum running below neutral too. Exchange traders are leaning short, which reads bearish, but the top traders are actually sitting long, so there's a genuine split between the crowd and the bigger players.
Longs have taken the brunt of recent liquidations, adding some near-term downside pressure, and funding swinging back positive after a volatile stretch shows leverage sentiment is still shaky.
The Telegram wallet catalyst adds a positive angle, but it still needs real adoption and technical confirmation to matter.
Overall, this points to a neutral-to-cautious near-term picture rather than anything clearly bullish or bearish.
The wallet news helps the fundamental case, but the daily chart and recent liquidations mean buyers still have to prove they can hold above $1.561.
What Could Invalidate the Bullish GRAM Price Prediction?
The bullish case weakens materially if $GRAM loses $1.449 and fails to reclaim it. A confirmed breakdown would shift attention toward $1.356 and then $1.286.
If selling accelerates further, $1.201 becomes the deeper support shown on the supplied chart.
Broader crypto-market weakness could also override a GRAM-specific catalyst. In addition, positive funding combined with renewed downside movement could leave leveraged longs vulnerable to another liquidation wave.
Conversely, because trader accounts are currently short-heavy, a strong resistance breakout could force bearish positions to adjust quickly and potentially amplify upside volatility.
What Is the Current GRAM Price Outlook?
As per CoinGabbar analyst, derivative, and catalyst evidence reviewed above, GRAM remains at a decision point rather than in a confirmed breakout.
The immediate technical bias stays cautious below $1.561, while the Telegram wallet rollout provides a potentially meaningful longer-term narrative.
For the bullish case, $1.561 is the first confirmation level, followed by $1.695 and $1.819. For the bearish case, $1.449 is the key line to defend.
Until either boundary breaks with confirmation, the $1.449–$1.561 region remains the central battleground for the next GRAM price move.
Disclaimer :This article is for informational and educational purposes only and should not be considered financial or investment advice. Cryptocurrency markets are highly volatile, and prices, derivatives positioning, and market conditions can change rapidly. Readers should conduct their own research and consult a qualified financial professional before making investment decisions.
Also read:
1 month ago
Good day everyone, My name is Rayan I was once a victim of $300,000 btc investment scam. I was so devastated at that point because the police won’t look into the matter. I made different enquiries on what to do to recover my lost bitcoin. A friend referred me to this recovery firm who was able to retrieve my stolen bitcoin. I contacted them on recoverydarek @gmail com and they came through in less than 24hrs after contacting them, to deliver my funds back to me.

1 month ago
Good day everyone, My name is Rayan I was once a victim of $300,000 btc investment scam. I was so devastated at that point because the police won’t look into the matter. I made different enquiries on what to do to recover my lost bitcoin. A friend referred me to this recovery firm who was able to retrieve my stolen bitcoin. I contacted them on recoverydarek @gmail com and they came through in less than 24hrs after contacting them, to deliver my funds back to me.

















