AKEDO Price Prediction: $AKE Trendline Break, Supports in Risk, Rally?

.jpg)
AKEDO is buzzing across trading communities right now after a sharp vertical rally suddenly ran into resistance and reversed.
Akedo positions itself as a multi-agent AI framework built for autonomous content creation inside the gaming industry, according to the project's own materials.
This AKEDO Price Prediction looks at what this trendline break could mean for AKE going forward. Stick around till the end to see what the charts are hinting at next.
AKEDO Price Prediction: Market Overview
| Metric | Value |
| Current Price | $0.001717117 |
| 24h Change | -10.5% |
| 24h Range | $0.00144 - $0.002236 |
| Market Cap | $38.521M |
| Fully Diluted Valuation | $168.981M |
| 24h Trading Volume | $82.247M |
| Circulating Supply | 22.796B $AKE |
| Total / Max Supply | 100B $AKE |
Source: Data from CoinGecko as of 20/07/2026. Figures may vary slightly across other tracking websites.
AKE price forecast: AKE Liquidation and Volume Data
Shorts have taken the bigger share of liquidations in the 4h, 12h, and 24h windows, while longs took more damage only in the shortest 1h window.
This mixed picture shows both sides have been caught out at different points during the sharp move, rather than one clean trend of trapped buyers or trapped sellers.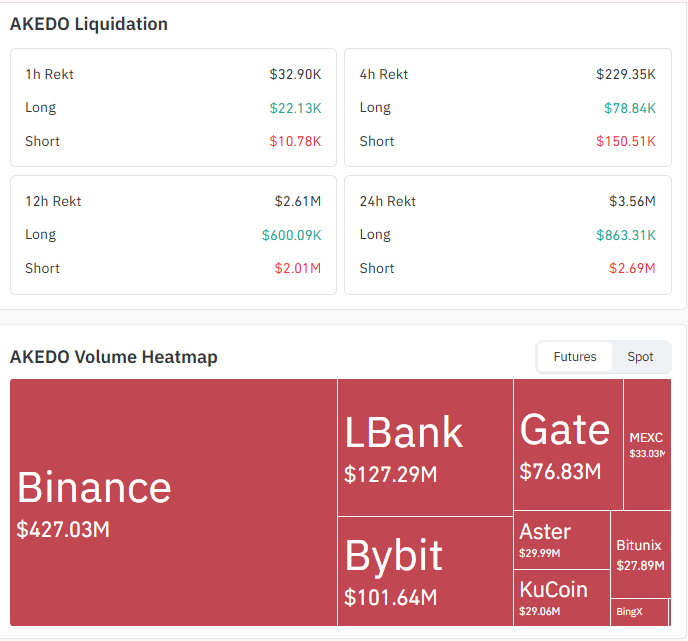
Source: Data From CoinGlass
Futures Volume by Exchange (Coinglass): Binance leads with $427.03M, followed by LBank at $127.29M, Bybit at $101.64M, Gate at $76.83M, MEXC at $33.03M, Aster at $29.99M, KuCoin at $29.06M, and Bitunix at $27.89M.
This futures volume is separate from the $82.247M spot trading volume reported by CoinGecko in the Market Overview table above. The two should not be combined, since they measure different markets.
| Timeframe | Total Liquidated | Long Liquidations | Short Liquidations |
| 1 Hour | $32.90K | $22.13K | $10.78K |
| 4 Hours | $229.35K | $78.84K | $150.51K |
| 12 Hours | $2.61M | $600.09K | $2.01M |
| 24 Hours | $3.56M | $863.31K | $2.69M |
AKE crypto news: Analyst View on the AKEDO Pullback
A widely followed crypto analyst known as "The Boss" shared a technical read on the AKE chart, framing the current red candle as the first clear sign of profit-taking after the price reached a major higher-timeframe supply zone. 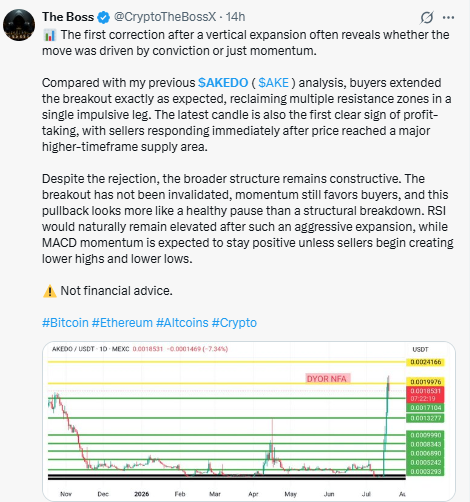
The analyst argues the broader structure remains constructive, that the breakout has not been invalidated, and that this pullback looks more like a healthy pause than a structural breakdown, with RSI expected to stay elevated and MACD momentum expected to stay positive unless sellers start printing lower highs and lower lows.
This is one analyst's third-party opinion shared publicly, and CoinGabbar could not independently verify this specific read.
It also sits apart from the trendline break structure visible on the chart, so readers should weigh both views rather than treating either as confirmed.
AKE price prediction 2026: AKE Price Chart Analysis
AKE rallied strongly along a rising trendline from July 15, climbing to the key resistance at $0.0020595 before briefly spiking toward $0.0024144.
Since then, the price has broken below the trendline and is now moving in a sideways range. If AKE breaks down the sideways range, the next support to watch is $0.001398, with deeper downside possible if selling pressure continues.
On the upside, buyers first need to reclaim the 9 EMA at $0.0017768 and the 20 EMA at $0.0018240. A close above both EMAs would signal renewed strength and increase the chances of a move toward the $0.0020595 resistance.
If AKE breaks and holds above that level, it could target the next resistance at $0.0024144.
AKE is trading around $0.0017117, remaining below both the 9 EMA and 20 EMA, as a bearish crossover has happened in the 9 & 20 EMAs, which keeps the short-term trend slightly bearish.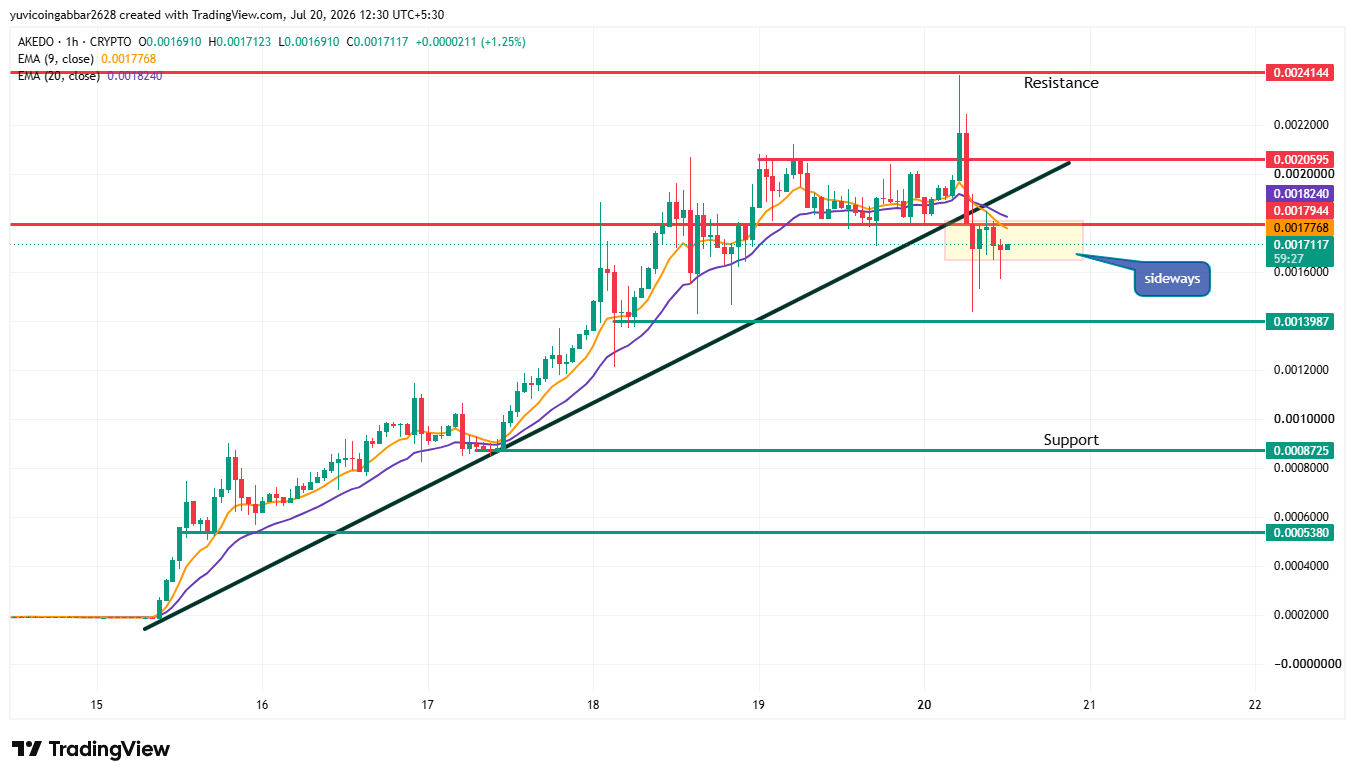
| Level Type | Price |
| Resistance | $0.0024144 |
| Resistance | $0.0020595 |
| Resistance (closer) | $0.0017944 |
| EMA 20 | $0.0018240 |
| EMA 9 (initial recovery level) | $0.0017768 |
| Immediate price reference | $0.0017117 |
| First support | $0.0013987 |
| Deeper support | $0.0008725 |
| Deeper support | $0.0005380 |
Verdict: With the trendline broken and price sideways below both EMAs, the first confirmed support at $0.0013987 is the level that keeps this pullback contained. A close back above the EMA 9 at $0.0017768 would be the first sign of an initial recovery.
Two Reader Takeaways
For existing holders, the level to watch is the first confirmed support at $0.0013987. A clean break below that shifts focus toward the deeper support levels at $0.0008725 and $0.0005380.
For anyone considering an entry, wait for AKE to reclaim the EMA 9 at $0.0017768 as an initial recovery signal, rather than entering while the trendline break is still unresolved.
AKEDO Market Outlook: Expert View
According to CoinGabbar analysts , the setup remains two-sided for now. A bullish trigger for AKE price recovery would be a close back above the EMA 9 and EMA 20, which would put the trendline break behind it.
A bearish trigger is already partly active, with the sideways range below the broken trendline keeping pressure on the first confirmed support at $0.0013987. A break below that level would open the door toward the deeper support zones.
Disclaimer: This is a technical read based on current chart structure and should not be treated as financial advice. Crypto markets are highly volatile, and a token that has already moved this sharply can continue to move sharply in either direction with little warning. Always do your own research before making any investment decision.
Also read:
















