Pump.Fun Price Prediction: $PUMP Flips Hyperliquid, Eyes $0.0022


Something shifted in the launchpad race this week, and it did not happen quietly.
The Pump.fun Price Prediction conversation picked up real heat after the platform posted a bigger 7-day revenue number than Hyperliquid, a name usually tied to serious derivatives volume rather than a memecoin launchpad.
$PUMP trades near $0.002005 at the time of writing, up over 10% in 24 hours. The chart is sitting right at the kind of level that decides where the next move goes.
Why Is Pump.Fun's Revenue Beating Hyperliquid Right Now?
A widely shared post from Pump.fun Ecosystem on X flagged the flip directly: the platform generated $7.45 million in 7-day revenue across four chains, edging out Hyperliquid's $7.31 million generated on a single chain.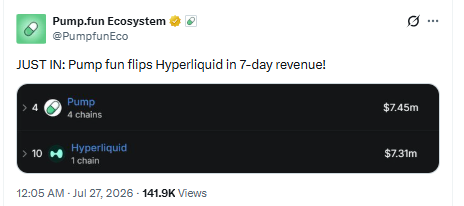
For a protocol many still file under "memecoin casino," that gap is not small to close against a derivatives giant.
Volume backs up the story too. $PUMP trading volume jumped over 171% to $85.6 million in a single day, per CoinMarketCap data, far outpacing the price gain itself.
That volume-to-price ratio usually points to real, conviction-driven buying rather than a thin, easily reversed spike that fades within hours.
What Do The Latest Pump.Fun Market Numbers Show?
As per the CoinMarketCap data, Pump.fun (PUMP) trades at $0.002005 with a $798.15 million market cap and $85.6 million daily volume as of July 27, 2026, 10:35 AM IST. Circulating supply sits at 397.94 billion tokens against a 1 trillion max supply, with hourly RSI near 67.
Broader market context matters here too. Bitcoin trades near $65,245 and Ethereum near $1,953, and CoinMarketCap's Altcoin Season Index has climbed 8% over the past week.
That rotation tends to pull capital toward higher-beta names like $PUMP, which trades as something of a proxy for risk appetite across the memecoin ecosystem.
How Is PUMP Trading On The 1-Hour Chart Today?
On the 1-hour TradingView chart, PUMP fell from $0.002076 down to a low of $0.001764 in a falling wedge before buyers stepped back in and broke the pattern.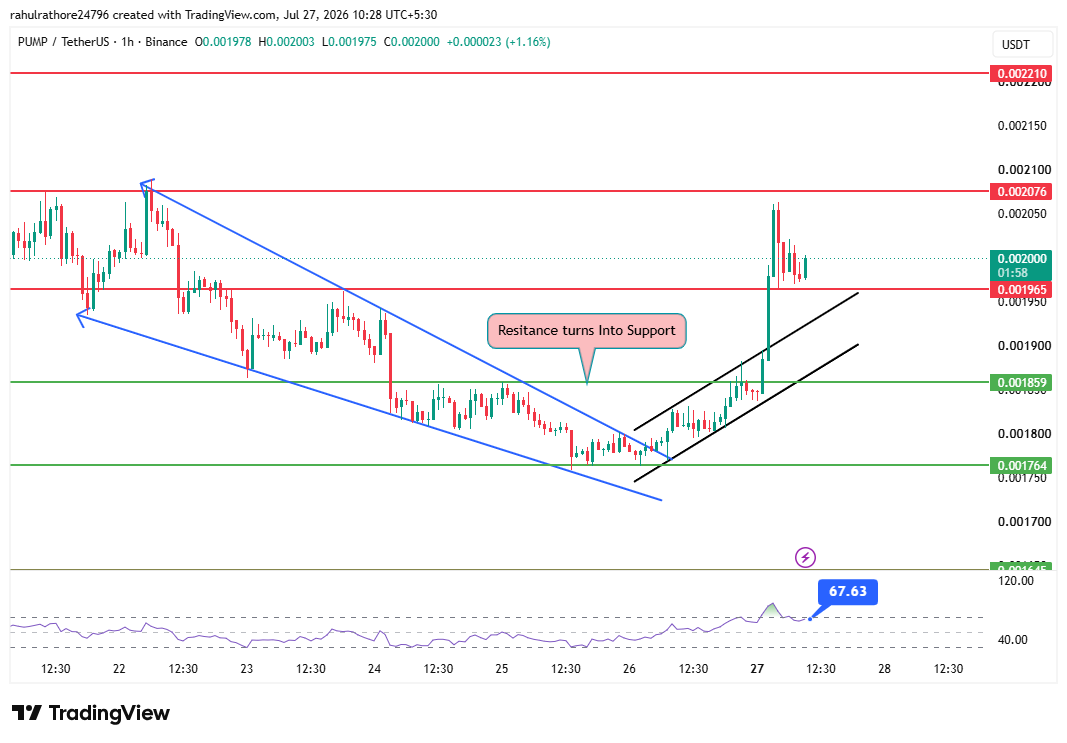
Price based itself at the $0.001764 level and started climbing inside a rising channel, a structure that usually signals short-term accumulation building underneath the surface rather than a random bounce.
As that channel developed, this Pump.fun Price Prediction setup saw the token break its earlier resistance at $0.001859 and flip it into support, a textbook bullish structural shift that traders watch for when a downtrend is losing steam.
Holding above a former resistance level after reclaiming it is often read as a sign that sellers who defended that zone have been absorbed.
What Happened When PUMP Tried To Break $0.002076?
From inside the rising channel, price eventually broke out entirely and pushed hard toward the $0.002076 resistance level, the same zone that started the earlier fall.
That attempt failed. PUMP pulled back to $0.001965 before finding its footing again and stabilizing near the current $0.002005 mark.
What Is The 1-Hour RSI Signaling Right Now?
RSI on the 1-hour chart reads 67.63 at the time of writing. That places momentum firmly in bullish territory without tipping into overbought extremes, which typically start closer to the 70-75 zone.
In practical terms, there is still some room for buyers to keep pushing before the indicator itself becomes a headwind.
What Happens If PUMP Breaks $0.002076 Resistance?
This Pump.fun Price Prediction scenario hinges on whether $0.002076 breaks with real volume.
A clean break above that level opens the door toward $0.002210, the next liquidity pocket on the hourly chart and the level momentum traders would likely target.
On the downside, losing the $0.001965 support could send the price back inside the broken rising channel.
A sharper rejection risks a slide toward $0.001859, and if selling pressure builds further, the pullback could stretch down to $0.001764, the low that started this current leg higher.
Glossary
Pump.fun (PUMP): A Solana-based memecoin launchpad that lets users create and trade meme tokens with minimal setup.
RSI (Relative Strength Index): A technical indicator that measures whether an asset is overbought or oversold based on recent price momentum.
Falling Channel: A bearish chart pattern where price moves between two downward-sloping parallel trendlines.
Liquidity Sweep: A price move that briefly breaks key support or resistance to trigger stop-loss orders before reversing direction.
Short Liquidation: When traders betting on lower prices are forced to close their positions due to rising prices, often accelerating an uptrend.
What Does The Daily Chart Say About Pump.Fun's Bigger Trend?
Zooming out to the daily TradingView chart changes the picture.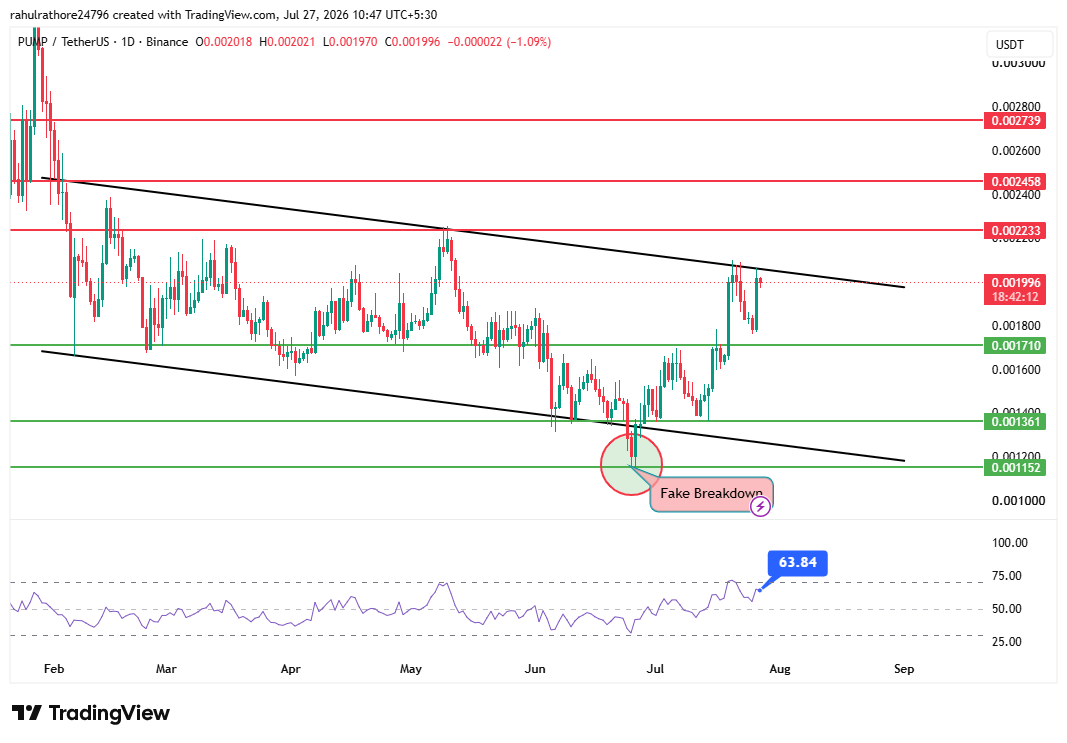
The token has been trading inside a falling channel since February 2026, respecting both the upper and lower edges of that structure with notable consistency for months.
That falling channel is the dominant trend that needs respect before any single hourly breakout gets too much credit.
What Happened During The June 25 Fake Breakdown?
On June 25, the price broke below the channel's lower edge, and for a moment it looked like the falling trend was accelerating. It turned out to be a fake breakdown.
Sellers who shorted that break got trapped as price swept the liquidity sitting below that level and reversed sharply, moving right back inside the channel within a short window.
That kind of liquidity sweep followed by a hard reversal is a pattern worth remembering, since it often marks a shift in control even when the bigger trend has not technically changed yet.
Where Is Price Testing Right Now On The Daily Chart?
Currently, price is testing the upper edge of that same falling channel, which is exactly why this week's move carries more weight than a typical daily bounce would.
A breakout attempt here is being tested against months of prior resistance at this same structural boundary.
Where Could PUMP Go If It Breaks The Falling Channel?
A confirmed breakout above the daily channel's upper edge could carry price toward $0.002233 first, based on prior chart structure in that zone.
Beyond that, $0.002458 stands as the next resistance, and $0.002793 sits further out as a level where price could react if bullish momentum extends that far.
If price instead reverses from the upper edge without breaking it, $0.001710 becomes the first support to watch.
A deeper pullback could test $0.001361, and the $0.001152 zone, the exact area where the June 25 fake breakdown found its liquidity sweep, stands as the last major line of defense for bulls on this timeframe.
Daily RSI currently reads 63.84, which is on the higher side but still short of overbought, leaving some room to run before the indicator itself flashes a warning.
What Does The Weekly Chart Suggest About A Bigger Rally?
A widely followed trader, MikybullCrypto on X, flagged $PUMP as sitting on a retest before what they called a major bullish rally, sharing a TradingView weekly chart showing price compressing along a descending trendline after months of grinding lower.
Weekly structure shows PUMP has spent a long stretch losing ground before this recent basing attempt began to take shape.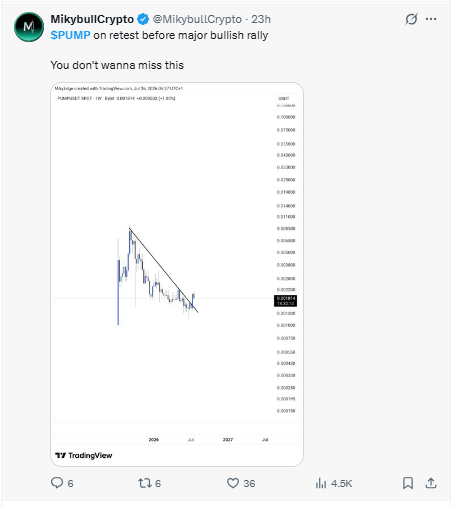
That weekly retest lines up with the daily channel resistance test happening right now, which adds some technical weight to the idea that the token could be building a bigger base rather than simply bouncing temporarily inside a larger downtrend.
What Does Pump.Fun Liquidation Data Reveal About Trader Positioning?
CoinGlass liquidation data shows shorts getting squeezed harder than longs across nearly every recent timeframe.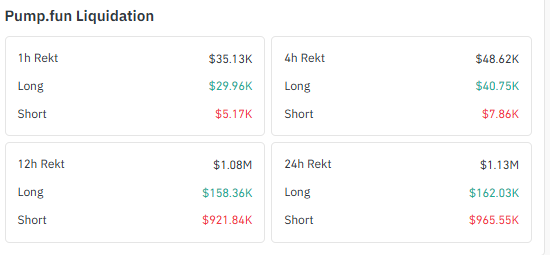
This lines up with the bullish price action seen on both the hourly and daily charts.
Timeframe | Total Liquidated | Long Liquidations | Short Liquidations |
1 Hour | $35.13K | $29.96K | $5.17K |
4 Hours | $48.62K | $40.75K | $7.86K |
12 Hours | $1.08M | $158.36K | $921.84K |
24 Hours | $1.13M | $162.03K | $965.55K |
That imbalance in the 12-hour and 24-hour windows suggests short sellers positioned against the token got caught offside as price pushed higher.
The resulting forced short covering likely added real fuel to the recent green candles rather than the move coming from organic spot demand alone.
Pump.Fun Price Prediction: Bull, Base, And Bear Case Table
Scenario | Target Range | Key Assumption | Invalidation Level |
Bull Case | $0.002233 – $0.002793 | Daily channel breakout confirms with sustained volume above $0.002076 | Close back below $0.001965 |
Base Case | $0.001859 – $0.002076 | Price stays range-bound between hourly support and resistance | Break of either boundary with volume |
Bear Case | $0.001361 – $0.001710 | Daily resistance holds and price rolls over | Reclaim of $0.001965 on strong volume |
These are technical projections based on current chart structure and are not guaranteed outcomes. Crypto markets remain highly volatile.
Pump.Fun (PUMP) Tokenomics Snapshot
Metric | Value |
Market Cap | $798.15M |
Fully Diluted Valuation | $2B |
Circulating Supply | 397.94B |
Total Supply | 846.2B |
Max Supply | 1T |
Holders | 126.25K |
Expert Opinion: Where Does PUMP Stand Technically?
CoinGabbar Analysts tracking this Pump.fun Price Prediction note the token's ability to flip Hyperliquid in weekly revenue adds a fundamental narrative to what would otherwise read as a purely technical bounce.
High volume paired with heavy short liquidation pressure over the past day points toward conviction-driven buying rather than a shallow spike that fades once momentum traders exit.
That said, the token remains inside a broader falling channel on the daily chart not yet decisively broken.
Until price clears the upper trendline with sustained volume confirmation, the current move could still be read as another test within a longer downtrend rather than a confirmed reversal.
The June 25 fake breakdown is a reminder this chart has trapped traders on both sides before.
YMYL Disclaimer: This article is for informational purposes only and should not be considered financial, investment, or trading advice. Cryptocurrency markets, including memecoin launchpad tokens, are highly volatile and speculative. Price predictions are based on technical chart analysis and publicly available data as of July 27, 2026, and may not reflect future performance. Readers should conduct their own research and consult a licensed financial advisor before making any investment decisions.
Also read: