Hyperliquid Price Prediction: HYPE Enters Its Most Important Zone Yet


Hyperliquid price prediction is stealing the spotlight again as HYPE starts looking ready for a move that could catch a lot of traders off guard.
The market has been watching this zone very closely, and the pressure keeps building with every passing hour. One strong move from here could completely change the short-term sentiment.
Quick Take: $HYPE is trading around $59.988, and the market is sitting at a make-or-break moment.
Bulls are trying to take control, while sellers are fighting to keep the price contained. The next move could come fast, and if momentum kicks in, traders should be ready for increased volatility.
Whether it turns into a breakout or a sharp rejection, this is one of those moments where everyone will be watching HYPE.
$HYPE Price Right Now And Market Snapshot
Metric | Value |
Price | $59.988 |
24h Change | +2.55% (+$1.4923) |
Market Cap | $15.11B |
Futures Volume (24h) | $1.08B |
Spot Volume (24h) | $67.59M |
Open Interest | $2.46B |
Circulating Supply | 252.68M HYPE |
Total Supply | 953.04M HYPE |
Max Supply | 953.04M HYPE |
The price is taken from the live TradingView chart, with volume, market cap, open interest, and supply figures from Hyperliquid data on the CoinGlass HYPE market page as of July 27, 2026, 09:37:06 morning IST.
Methodology And Data Sources
This $HYPE technical analysis uses the 1-hour HYPE/USDT chart on Binance via TradingView for price structure, with volume, open interest, and market cap figures from CoinGlass and liquidation flow from CoinGlass's HYPE liquidation tracker.
All levels are treated as invalidated only on a confirmed 1-hour candle close beyond the stated trigger, not an intraday wick.
Why Is $HYPE Price Moving Today
Onchain activity is giving this Hyperliquid price prediction some extra weight beyond the chart itself.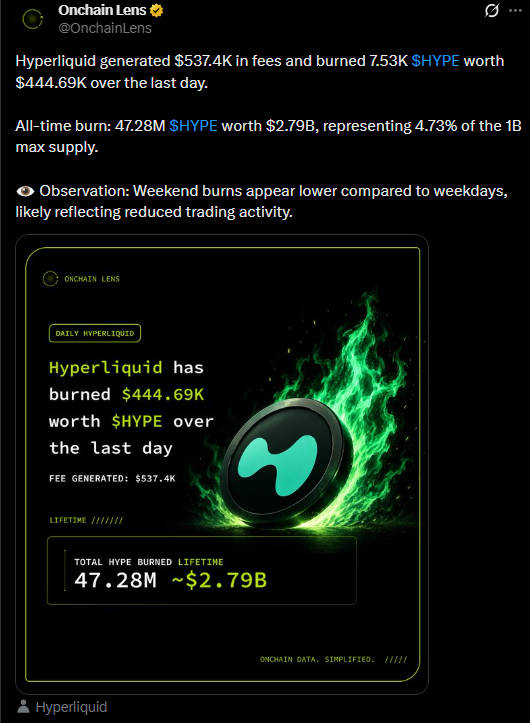
As per an Onchain Lens update on $HYPE burn data, the network generated $537.4K in fees and burned 7.53K HYPE worth $444.69K over the last day alone, taking the all-time burn total to 47.28M HYPE worth roughly $2.79B, close to 4.73% of the 1B max supply.
That kind of steady deflationary pressure tends to support price over time even when short-term flows look choppy.
On the ETF side, the picture is more mixed. Daily data shows outflows of roughly $6.89M on July 24 and $1.02M on July 23, with the cumulative net inflow figure slipping to $292.73M and total net assets down to $288.40M, a pullback from the $306.30M level seen on July 21.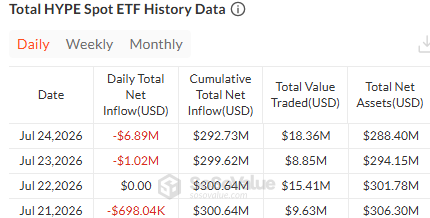
The full flow history sits on the HYPE spot ETF tracking page. Reduced institutional demand alongside ongoing token burns creates a genuine tug of war, which is exactly why the technical levels below matter so much right now.
$HYPE Liquidation Data And Long Short Squeeze
Liquidation flow over the past day leans heavily toward short sellers getting caught out, a sign that traders betting against the move have been repeatedly wrong-footed.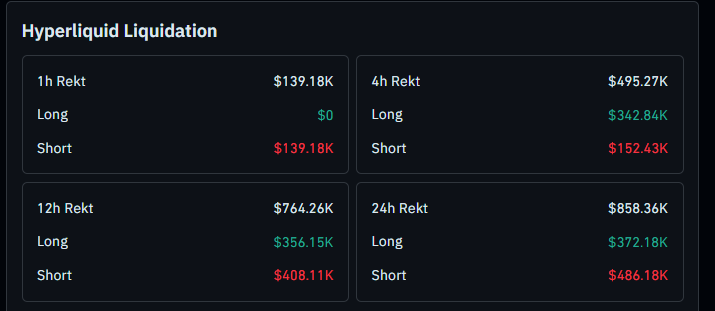
Over the past hour, $139.18K was liquidated, and every bit of it came from shorts, with longs untouched.
The 4-hour window flips slightly, with $495.27K total split between $342.84K in longs and $152.43K in shorts.
Zooming out, the 12-hour window shows $764.26K in total liquidations, with shorts taking the bigger hit at $408.11K against $356.15K in longs.
Across the full 24 hours, liquidations reach $858.36K, and shorts again make up the larger share at $486.18K versus $372.18K in longs.
That short-heavy skew across most windows fits a market where dip buyers keep stepping in and squeezing anyone positioned for a breakdown.
The complete breakdown sits on the HYPE liquidations dashboard on CoinGlass.
$HYPE Technical Analysis Ascending Trendline Breakout Setup
$HYPE has been climbing along a clean ascending trendline, and this structure has now been tested and held five separate times.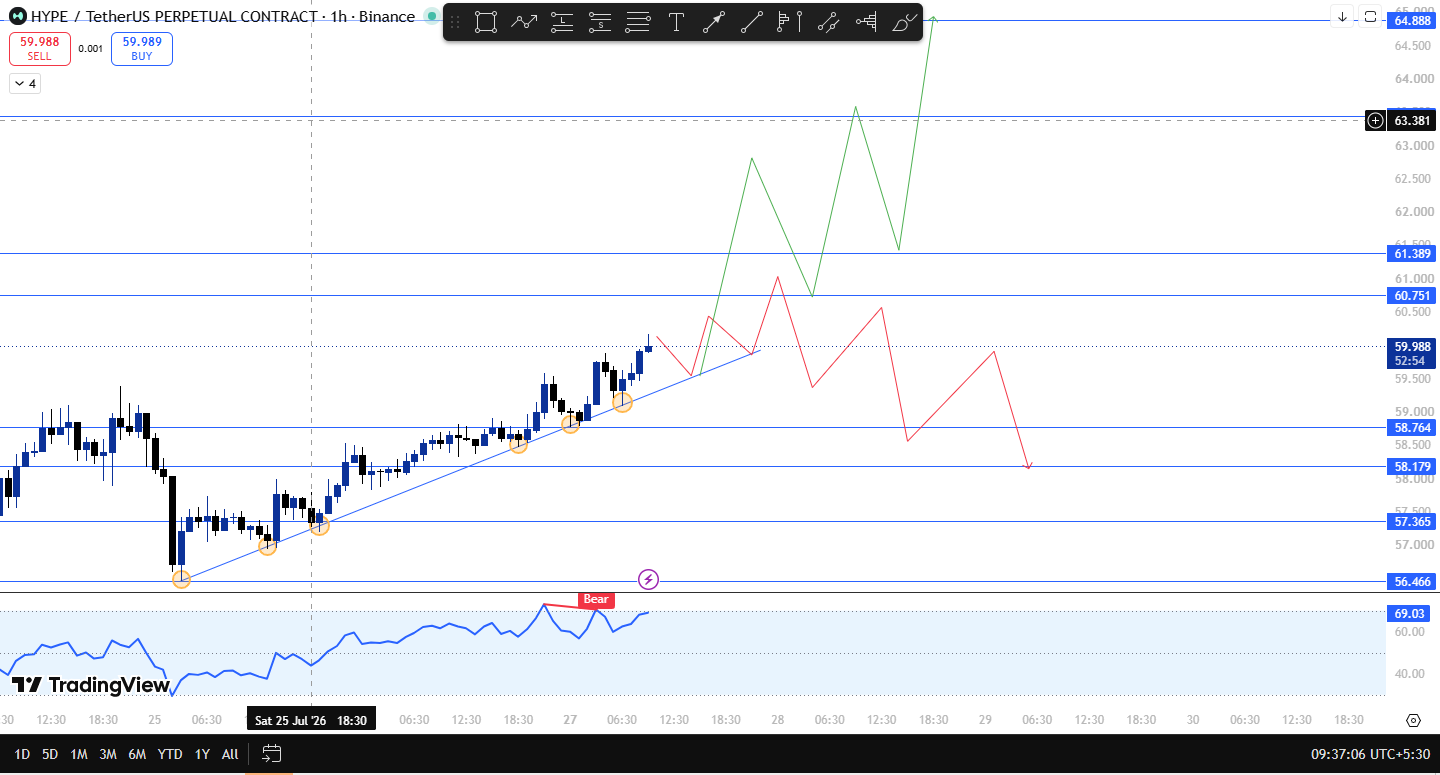
What stands out is that every single retest has produced a new higher high rather than just a bounce back to the same level, which is usually a sign that buyers are gradually taking more control rather than just defending old ground.
Right now the price is sitting just under $60.751, which is acting as the near-term ceiling. If HYPE breaks above that level and a 1-hour candle closes above it, that confirms the breakout is underway and opens the path toward $61.389, with $63.447 as the next stretch target and $64.888 as a further extension if momentum keeps building.
That said, this move is unlikely to happen in one straight shot. HYPE will likely need to sustain a close above $60.751 first before a fresh breakout attempt can carry price meaningfully higher, similar to the pattern flagged in our sellers losing control coverage.
On the downside, if HYPE breaks $59.764 and closes an hourly candle below it, that invalidates the near-term bullish continuation and opens $58.179 as the next support, with $57.365 as the level after that, a scenario that lines up with the setup covered in our HYPE pullback and breakdown levels piece.
Worth flagging too, the RSI on the hourly chart is sitting near 69, and there is an early bearish divergence tag showing up even as price keeps printing higher highs.
That does not break the trendline story, but it is a reason to want a clean close above $60.751 rather than assume the breakout automatically.
HYPE Glossary Of Key Trading Terms
Ascending Trendline: A support line that keeps climbing as it connects a series of higher lows. Traders use it to map out an uptrend and see exactly where buyers keep jumping back in.
RSI (Relative Strength Index): A momentum gauge that shows how quickly and how far price has moved. Traders lean on it to catch overbought conditions or spot early divergence before price reacts.
Liquidation: This is what happens when a leveraged position gets wiped out because there isn't enough margin left to keep it running. The exchange force-closes it.
Open Interest: The total dollar value tied up in outstanding derivative contracts. It's basically a read on how much leverage is sitting in the market at any given time.
Token Burn: Tokens getting permanently pulled out of circulation. Protocols often do this to counterbalance new supply hitting the market or to reward on-chain activity.
Spot ETF Outflow: When money flows out of an ETF on net, it is usually read as a sign that institutional appetite is cooling off.
HYPE Technical Snapshot
Indicator | Signal |
Trend | Ascending trendline holding up, five clean retests so far, each one printing a fresh higher high |
Structure | Sitting just below the $60.751 resistance zone, the breakout is still unconfirmed |
RSI | Hovering near 69, with early bearish divergence quietly building even as price makes higher highs |
Liquidations | Shorts have been getting liquidated more than longs across most windows in the past 24 hours |
Key Trigger | An hourly close above $60.751 would confirm the breakout; a close below $59.764 kills the setup |
Broader Catalyst | Consistent HYPE burns are helping cushion the impact of recent spot ETF outflows |
HYPE Support And Resistance Levels To Watch
Type | Level | Note |
Resistance 3 | $64.888 | Further upside target |
Resistance 2 | $63.447 | Next stop once breakout confirms |
Resistance 1 | $60.751 | The breakout trigger, on a 1h closing basis |
Current Price | $59.988 | Sitting just under the trigger level |
Support 1 | $59.764 | Where invalidation kicks in on a confirmed close below |
Support 2 | $58.179 | Next support if $59.764 gives way |
Support 3 | $57.365 | Deeper cushion if the drop continues |
Risk-Reward Snapshot For HYPE Traders
Case | Trigger | Target |
Bull Case | 1h close above $60.751 | Push toward $61.389, then $63.447, with room to extend to $64.888 |
Bear Case | 1h close below $59.764 | Drop toward $58.179, then $57.365 |
The bullish trendline structure on HYPE remains valid as long as price manages to hold above $59.764 on an hourly closing basis.
Once that level breaks on a confirmed close, the near-term bullish continuation is off the table, and attention turns to $58.179 first, then $57.365 after that.
Flip side, an hourly close above $60.751 would confirm the breakout is genuinely underway, opening the door toward $61.389 and then $63.447.
That said, HYPE will probably need to hold above $60.751 for a bit before any serious attempt at $64.888 comes into play, something our HYPE decision range analysis also flags from the sustained-breakout angle.
Expert Take On The Hyperliquid Price Prediction
Traders watching this Hyperliquid price prediction point out that five retests of the ascending trendline are a solid bullish tell, especially since each bounce has come with a fresh higher high instead of just repeating the same level.
The ongoing token burns are giving the setup a bit of fundamental support too, helping absorb some of the pressure from recent spot ETF outflows, while the short-heavy liquidation pattern hints that dip buyers haven't backed off.
That said, the early RSI divergence combined with the price still not having closed above $60.751 means the breakout isn't confirmed yet.
Whichever way the next hourly close breaks is likely to set the tone for the sessions ahead, a theme our Hyperliquid price prediction today update also tracks closely.
Disclaimer: This technical analysis is for educational purposes only and shouldn't be treated as financial or investment advice. Crypto markets are highly volatile.