Quai Network Price Prediction: Why Is QUAI Price Surging Today?


Quai Network just moved nearly 30% in a single day, and traders are trying to figure out what comes next. Is this the start of something bigger, or just another quick spike that fades away?
A Sudden Jump Has Traders Watching Quai Network Closely
Quai Network price prediction chatter picked up fast after $QUAI ripped higher in the last 24 hours. The move caught plenty of people off guard.
Turns out, this kind of jump doesn't happen without a reason. Volume spiked hard, and that usually means something real is going on underneath the surface.
Here's the thing: a 28% daily gain on a small-cap token gets attention, especially with the crypto market rally already a hot search on its own. But it also raises a fair question. Can the price actually hold these gains, or is this a classic pump that cools off just as fast?
We pulled up the chart, and the first thing that stood out was how tight the recent price action has been. The token had been stuck in a falling range for days before this move showed up.
So what changed? And more importantly, does it last?
What Is Quai Network And Why People Are Watching $QUAI
Quai Network is a proof-of-work blockchain built around the idea that mining should also fund the network's own economy. It runs on its own chain rather than sitting on top of Ethereum or Solana.
The project launched with the goal of merging mining rewards into a system called SOAP, where that mining revenue helps buy back and burn $QUAI tokens. That is a different model from most newer coins that skip mining altogether.
Quai Network Price And Market Snapshot Right Now
| Metric | Data |
|---|---|
| Coin Name | Quai Network |
| Ticker Symbol | QUAI |
| Blockchain | Quai Network (Own PoW Chain) |
| Today High | $0.02028 |
| Today Low | $0.01381 |
| RSI Level | 57.25 |
| Token Type | Native, Proof-of-Work |
| Token Category | Layer 1, Energy Money |
| Market Cap | $14.21M |
| 24H Trading Volume | $563K |
| 24H Trading Volume Change | +52.75% |
| Circulating Supply | 782.48M QUAI |
| 24H Change | +28.16% |
Source: Data by CoinMarketCap
How Far Quai Network Has Fallen And Bounced Back Since Launch
$QUAI is still a long way from its all-time high of $0.364, set back in February 2025. That level looks almost distant now, down nearly 95% from where the coin sits today.
But the other side of that story matters too. $QUAI hit an all-time low of $0.009024 just fifteen days ago. From that low, the token has already doubled, gaining over 102%.
That's a wild swing in a short window. It tells us volatility here is extreme in both directions, not just one.
Recent Ecosystem Activity Behind The Quai Network Move
Turns out this rally isn't happening in a vacuum. Quai Network's team has been pushing several updates lately, and traders scanning the latest crypto market news tend to react before the fundamentals fully play out.
The team recently talked up its SOAP buyback model, explaining that a proof-of-work network already pays for its own security. Merge mining lets that same computing work generates outside revenue as well, and that revenue then goes toward $QUAI buybacks and burns, according to the project.
Around the same time, a separate post pointed to new coverage exploring Quai Network, its QI token, the SOAP mechanism, and what the team calls its Energy Money thesis for a future that needs more computing power.
On top of that, Quainance launched as the central decentralized finance hub for Quai Network, combining swaps, bridging, liquidity provision, live stats, and position tracking in one place, and it was featured in Disruption Banking alongside coverage tracking crypto airdrops and other ecosystem launches.
On the network side, Quai Network's own explorer shows steady activity, with over 89 million total transactions processed and average block times sitting around 4.9 seconds. That kind of throughput data matters when judging whether a chain is actually being used.

Source: Posted on X by QuaiNetwork
$QUAI Technical Analysis: Why This Chart Move Is Getting Attention From Traders
Price moved up before the indicators did, and that order matters. Buyers stepped in aggressively, pushing $QUAI out of a multi-day descending channel that had capped upside for over a week.
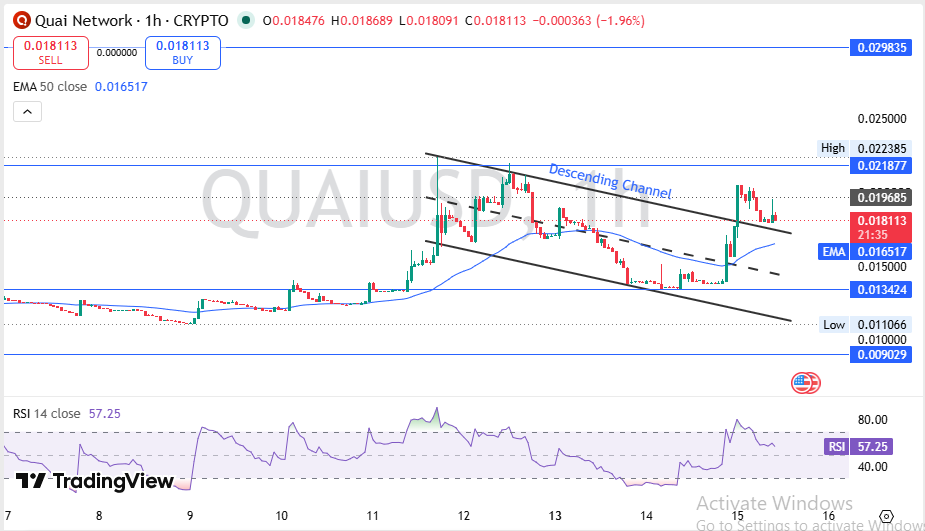
Source: Charting by TradingView
Basically, the breakout came first, and the RSI followed it higher afterward, now sitting at 57.25. That's not overbought territory yet, which leaves some room left if buyers stay active.
Turns out, this kind of structure shift often shows up right before a bigger move gets underway, one way or another. The 50 EMA on the hourly chart sits at $0.016517, and the price is currently trading above it. That's a short-term bullish signal, though one candle can flip it back just as fast.
Immediate resistance sits at $0.021877, with a bigger ceiling up near $0.029835. On the downside, $0.013424 is the level bulls need to defend if this move starts losing steam.
Volume needs to stay elevated for any of this to actually hold. Without it, breakouts like this one tend to fade just as quickly as they showed up.
Quai Network Versus Other Small-Cap Proof-of-Work Tokens
Compared to other proof-of-work projects still active today, Quai Network stands out for combining mining with an internal buyback mechanism rather than relying purely on inflation or fixed supply narratives.
Most newer layer-1 tokens skip mining entirely in favor of staking, which makes Quai's approach a bit of an outlier next to a Bitcoin price outlook built purely on scarcity or a Solana price action story driven mostly by network throughput.
Quai Network Price Prediction For The Next Few Weeks
Short-term price action will likely stay choppy as the market decides whether this breakout has real legs, and it's worth keeping half an eye on the coin events calendar for anything that could shake things loose.
| Timeframe | Bearish Target | Base Target | Bullish Target | Key Trigger |
|---|---|---|---|---|
| 24 Hours | $0.0165 | $0.0181 | $0.0203 | Volume holding above average |
| 3-7 Days | $0.0150 | $0.0190 | $0.0219 | Clean close above resistance |
| 2-4 Weeks | $0.0134 | $0.0200 | $0.0298 | Sustained buyer interest |
Watch the volume. If it fades, this move fades with it.
Quai Network Long-Term Price Outlook Through Next Year
The bigger picture depends on whether Quai Network can turn ecosystem news into real, lasting demand for the token, the same way capital shifts have played out across the wider Ethereum ecosystem over past cycles.
| Timeframe | Bearish Target | Base Target | Bullish Target | Catalyst Needed |
|---|---|---|---|---|
| 3 Months | $0.011 | $0.022 | $0.035 | Quainance usage grows steadily |
| 6 Months | $0.009 | $0.028 | $0.050 | SOAP buybacks show measurable impact |
| End of 2026 | $0.012 | $0.035 | $0.070 | Broader altcoin market recovery |
| 2027 Outlook | $0.015 | $0.050 | $0.100 | Wider merge-mining adoption |
Honestly, the long-term case leans more speculative than proven right now. It's not weak, but it needs real usage numbers to back it up.
Three Price Scenarios Traders Should Be Watching
Worst Case: Buyers fail to defend $0.013424, and broader crypto sentiment turns risk-off. Price slides back toward the recent low near $0.009.
Base Case: $QUAI holds above the 50 EMA and grinds sideways between $0.016 and $0.021. Ecosystem news keeps interest alive without a major breakout.
Best Case: Volume stays strong, resistance at $0.021877 breaks with conviction, and price pushes toward $0.0298 as new buyers chase the move.
| Scenario | Price Range | What Triggers It |
|---|---|---|
| Worst Case | $0.009 - $0.012 | Support breaks; sentiment turns negative |
| Base Case | $0.016 - $0.021 | Sideways consolidation continues |
| Best Case | $0.025 - $0.030 | Resistance breaks on strong volume |
Key Quai Network Price Levels Every Trader Should Watch
Resistance zone: $0.021877 and then $0.029835 above that, both capping upside on the hourly chart.
Support zone: $0.013424, the level that has held on recent pullbacks.
Invalidation zone: Below $0.009029, the recent all-time low. A close under this would break the current bullish structure entirely.
Analyst View And Final Thoughts On $QUAI Network's Next Move
The chart setup right now leans cautiously bullish. Price broke a descending channel, RSI is climbing without being overbought, and volume backed the move.
But one breakout candle doesn't confirm a trend. A weekly close above $0.021877 would say a lot more than this single daily spike does.
One thing worth tracking beyond the chart is whether Quainance actually pulls in liquidity now that it's live. That kind of real usage tends to matter more than any single tweet.
RSI near 57 leaves room to run before overbought conditions kick in. That's a small edge for bulls, not a guarantee, and it's worth checking the fear and greed index too since broader sentiment can override a single chart pretty fast.
The $0.013424 support level is the one to watch most closely here. Lose it, and the recent optimism fades quickly.
For now, the setup favors patience over chasing the pump.
Disclaimer
This article is for educational purposes only and does not constitute financial advice. Crypto markets are volatile. Consult your investment advisor before making any investment decision.
Also read:

















