Is Saylor's Bitcoin Adoption Index and CPI Data Behind the BTC Rally?


Bitcoin is trading near $64,700 today, its best move in weeks. The jump came after fresh US inflation data came in cooler than expected, giving traders a reason to buy risk assets again.
What is the Bitcoin price today?
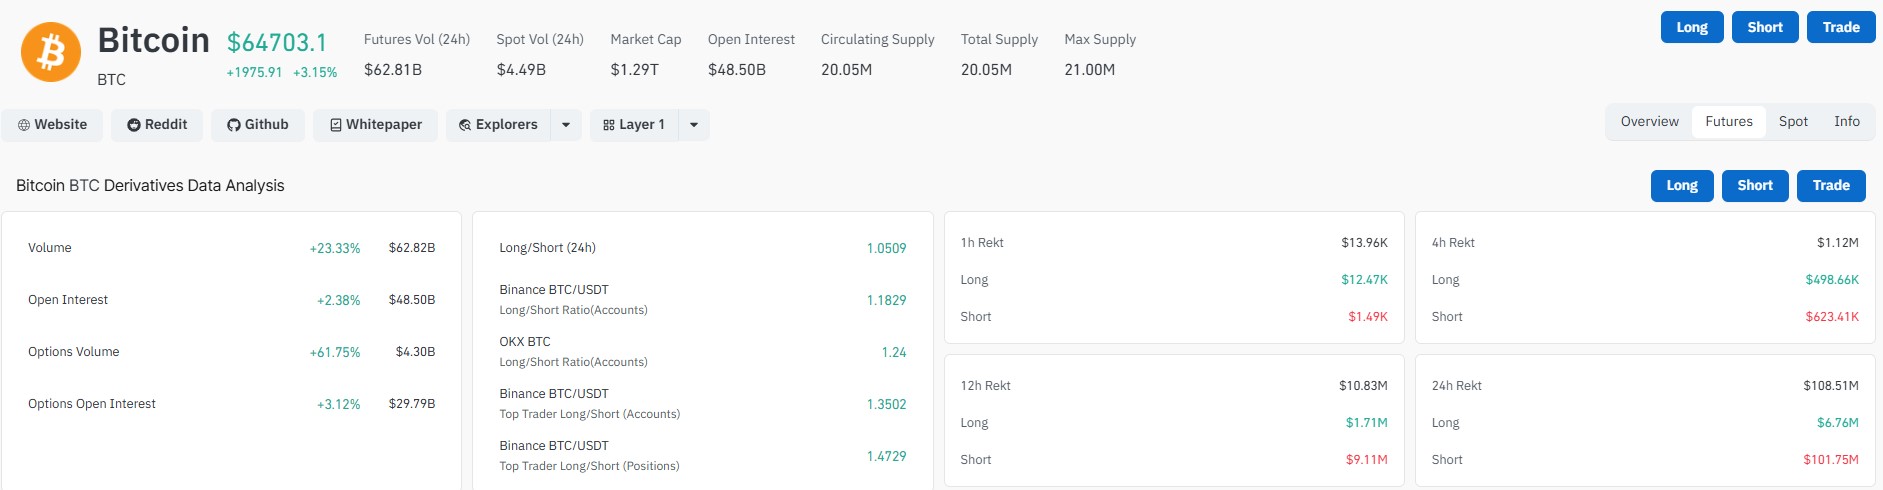
Bitcoin (BTC) is trading at $64,703, up 3.15% in the past 24 hours. That puts BTC up 3.2% on the week.
Spot volume sits near $4.49 billion, while futures volume jumped over 23% to $62.81 billion. Open interest rose 2.38% to $48.50 billion, and options volume climbed 61.75% to $4.30 billion.
Metric | Figure |
BTC price | $64,703.10 |
24h change | +3.15% |
7-day change | +3.2% |
Market cap | $1.29T |
Spot volume (24h) | $4.49B |
Futures volume (24h) | $62.81B |
Open interest | $48.50B |
Options open interest | $29.79B |
Why is Bitcoin price rising today?
The move followed the June US CPI inflation report. Headline inflation cooled to 3.5% from 4.2%. Core inflation, which strips out food and energy, eased to 2.6% from 2.9%.
That drop matters because it takes pressure off the Federal Reserve to raise interest rates. Odds of a rate hike this month fell from 43% to just 13% right after the data came out. The 2-year Treasury yield dropped six basis points too.
Higher rates usually hurt BTC, since safer assets like bonds start paying more. When rate hike odds fade, money tends to flow back into riskier bets like crypto.
BTC was not alone. Ether jumped 5.1% to near $1,870. XRP rose 3.3% to $1.10. Solana gained 3.8% to $77.80. BNB added 1.5% to $579.
What does BTC technical analysis show today?
The daily chart shows the coin is bounced off a rising trendline near $60,000 in early June and has climbed back inside a broader ascending channel.
Price is now testing resistance around $65,000 to $67,900. RSI sits at 55.17, which is a neutral to mildly bullish reading, not yet overbought.
A clean break above $65,477 could open the door toward $67,968 and then the $74,000 zone marked on the chart.
A rejection here could send price back toward the $62,000 support area.
What are the key Bitcoin liquidation levels right now?
Level | Price | Data |
Nearest long liquidation | $63,560 | 53.78M at risk |
Nearest short liquidation | $65,477 | 53.34M at risk |
Cumulative long liquidations (downside) | Below $64,705 | Builds toward $58,160 |
Cumulative short liquidations (upside) | Above $64,705 | Builds toward $71,359 |
Coinglass data shows the liquidation map is fairly balanced right now. A move through $65,477 could trigger short covering, while a drop under $63,560 may push more longs out of their positions.
Over the past 24 hours, 66,349 traders were liquidated across the market, totaling $327.36 million. The single largest liquidation hit Binance on an ETHUSDT position worth $6.37 million.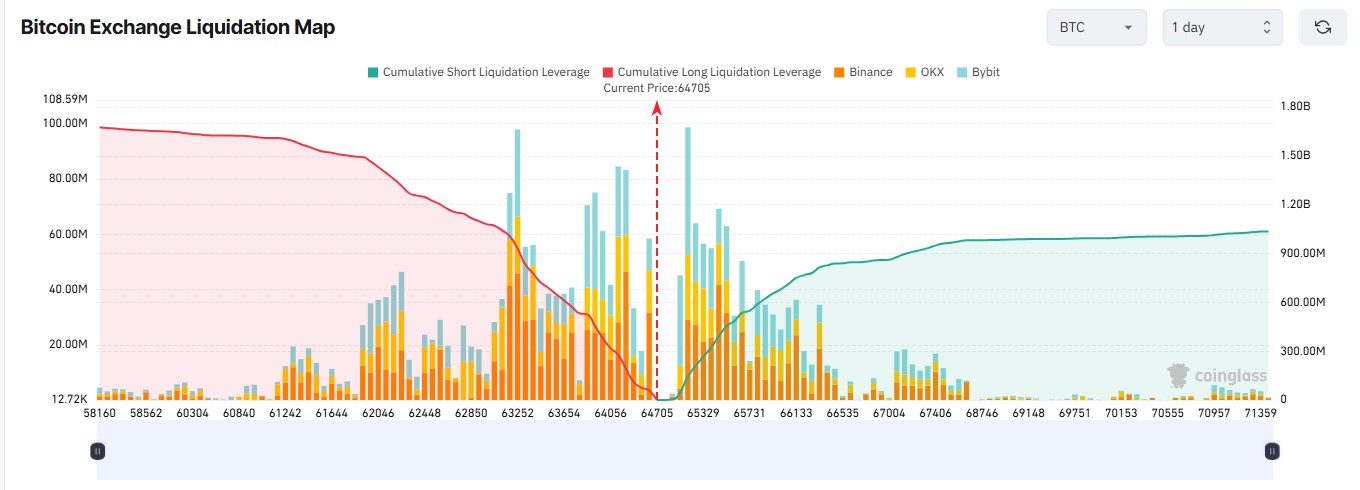
Is Bitcoin holder demand growing?
Yes. Data from Ali Charts shows wallets holding 1 BTC or more grew nearly 0.4% since June. That means over 4,000 new $BTC holders joined the network in that stretch, even while price chopped sideways in the low $60,000s.
Santiment data adds more context. Wrapped Bitcoin (WBTC) saw 326 tokens, worth about $20.8 million, move off exchanges in a single day. That is the largest one-day outflow in six weeks. Coins leaving exchanges are generally seen as less likely to be sold soon.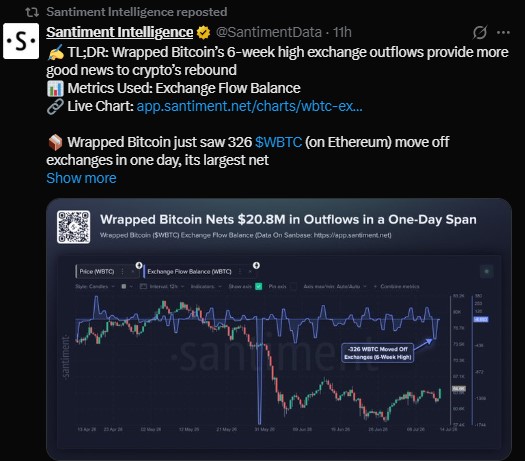
Meanwhile, SoSoValue reported BTC ETFs pulled in $181.08 million in net inflows yesterday, adding another layer of demand behind the price move.
What is Michael Saylor's new Bitcoin Banking Adoption Index?
Michael Saylor announced the launch of the Bitcoin Banking Adoption Index on July 13. He said major-bank BTC adoption is accelerating, but still early, with the index reading 32% overall.
The index was introduced by Strategy president Phong Le. It tracks how major banks and financial institutions are adopting $BTC and the wider digital asset ecosystem across categories like ETF trading, BTC trading, custody, stablecoin activity, blockchain use, tokens, and leadership.
The chart lists large global banks including Fidelity, Goldman Sachs, JPMorgan Chase, Morgan Stanley, Citigroup, Wells Fargo, HSBC, Charles Schwab, Bank of America, Barclays, Standard Chartered, State Street, Deutsche Bank, UBS, and Royal Bank of Canada, scoring each on their level of Bitcoin-related adoption.
Saylor and Le said methodology details and future updates to the index are still to come.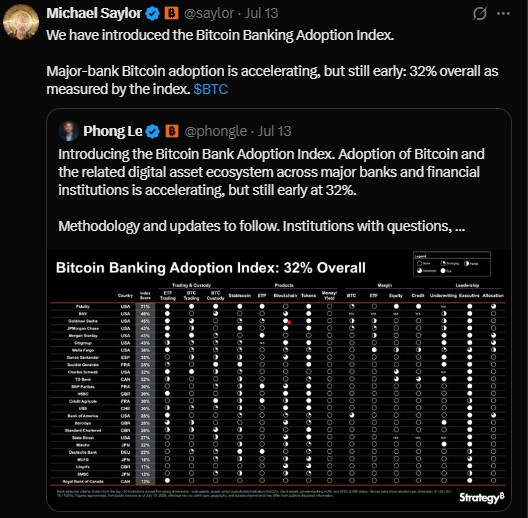
Where is $BTC price headed next?
Bitcoin price forecast now hinges on whether buyers can clear the $65,000 to $67,900 resistance zone. Cooling inflation gives the broader market room to breathe, and steady ETF inflows plus rising holder counts point to underlying demand.
Still, trading volumes across top crypto assets have been fading since mid-2024 and remain near two-year lows, according to Santiment. Thin volume can help clean setups form, but it can also make rallies easier to fade if sellers step back in.
The new Bitcoin Banking Adoption Index adds a longer-term angle. At 32% overall, major banks are still early in adopting Bitcoin, but the trend Saylor points to suggests more institutional participation could build over time, a potential tailwind beyond this week's price swings.
No one can guarantee where $BTC goes next. Traders will likely watch the $65,477 and $63,560 liquidation zones closely in the coming sessions for signs of which way momentum breaks.
Disclaimer: This article is for informational purposes only and does not constitute financial, investment, or trading advice. Cryptocurrency markets are highly volatile and carry significant risk. Always do your own research and consult a licensed financial advisor before making investment decisions.
Also read:

















