RedStone Price Prediction: Why Is RED Pumping Right Now?


RED just moved fast, and a lot of traders got caught watching from the sidelines. This piece walks through what triggered the spike, where the coin sits today, and what has to happen next for the move to hold.
A Coin Nobody Was Watching Suddenly Woke Up
RedStone price prediction conversations are trending again, and that alone tells you something changed. This is not a random green candle. It's a coin that spent weeks grinding sideways and then broke out on volume nobody could ignore.
We watched the order books fill up fast this morning. Buyers showed up in size, and sellers backed off.
That combination does not happen by accident. But is this a real trend reversal, or just another short squeeze that fades by next week?
Key Takeaways
-
RED traded near $0.1003 at 09:32 UTC on August 18, 2026, up roughly 20% on the day.
-
The rally follows a fresh 24-hour low of $0.08247, so this bounce came off a genuine bottom.
-
Whale concentration sits near 95%, a structural risk worth watching.
-
The base case targets $0.022–$0.032 over the next 30 days if volume holds.
-
A daily close below $0.020 would invalidate the near-term bullish setup.
Why Is RedStone Price Moving Today?
Most double-digit pumps have a real trigger, and this one does too.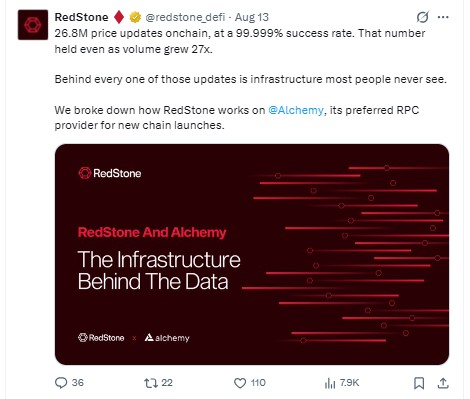
RedStone, the oracle network feeding price data on-chain, posted an update on its infrastructure partnership with Alchemy, its preferred RPC provider for new chain launches. The project said it processed 26.8 million price updates on-chain at a 99.999% success rate, holding steady even as volume grew 27x.
That's an operational milestone, not marketing fluff.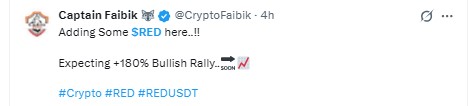
It landed right as trader accounts pushed RedStone price prediction chatter, including a call from CryptoFaibik on X for a sharp rally. Retail attention followed within hours.
Turns out, infrastructure news plus social buzz moves thin-cap tokens fast. The Alchemy update is verified directly from RedStone's own account. The single trader's rally call is not fact, and readers should treat it as opinion.
For a deeper look at how this catalyst stacks up against prior moves, RED token target analysis breaks down the same rally from a different angle.
Where Is the $RED Price Right Now?
As of 09:32 UTC on August 18, 2026, RED traded at $0.1003, up about 20.26% over 24 hours, per CoinMarketCap data.
The intraday range ran from a low of $0.08247, a fresh all-time low set just one day earlier, up to a high near $0.1134. Traders curious about what a sustainable listing floor looks like can check the listing price breakdown for RedStone's earlier trading history.
Market cap sits near $48.6 million, with 24-hour trading volume around $37.82 million, a volume-to-market-cap ratio above 72%. That's a hot ratio for a token this size.
Fully diluted valuation stands close to $100.26 million, roughly double the market cap, since only about 484.22 million of the 1 billion total supply is circulating.
RedStone Daily Technical Chart Analysis
On the daily chart, RED has been carving out a descending channel since May, a pattern where trading keeps bouncing between a falling support line and a falling resistance line. Every rally inside that channel got sold, over and over, until today.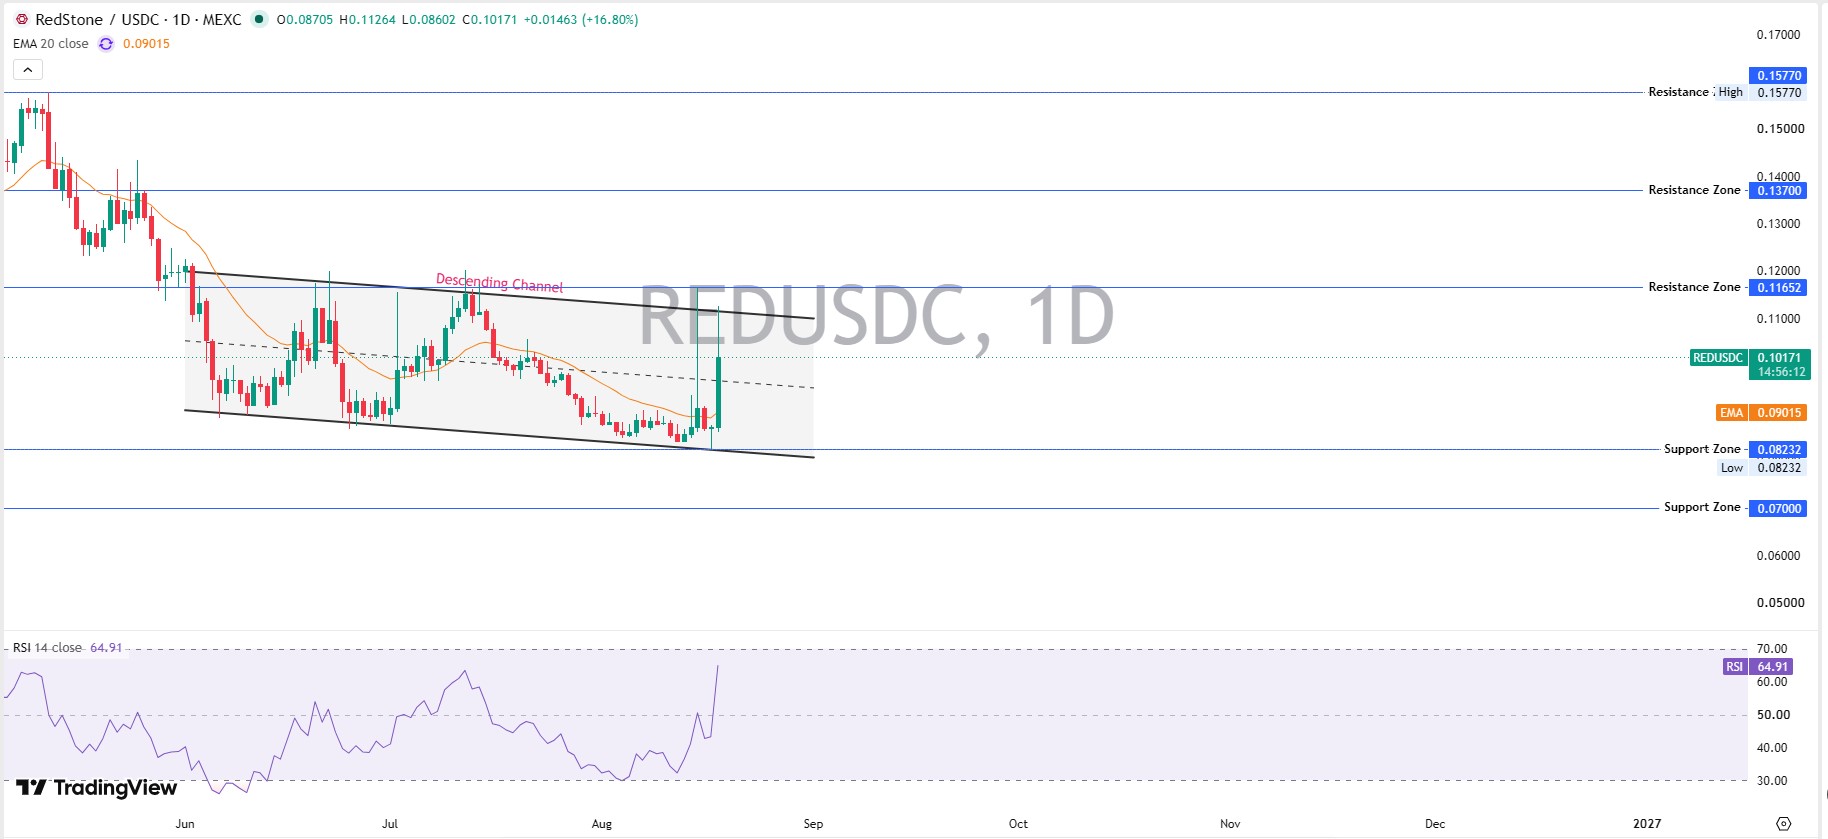
Today's candle broke sharply above the channel's mid-zone on heavy volume, and that's the part worth paying attention to.
RSI (Relative Strength Index, a momentum gauge from 0 to 100) sits at 64.91, below overbought territory but trending up fast from the low-30s just a week ago. That kind of jump usually means fresh buyers stepped in, not just short-covering.
The 20-period EMA (exponential moving average, a trend line weighing recent trading more heavily than older data) sits near $0.09015, and trading has pushed above it for the first time since the channel formed.
Immediate resistance zones sit at $0.11652 and then $0.13700, both levels where trading previously stalled and reversed. Support has formed near $0.08232, the recent low, with a deeper zone around $0.07000 if that fails.
Volume matters here too. Today's session volume ran well above the 20-day average, and that kind of participation is what separates a real breakout attempt from a low-liquidity wick. Chart structure like this shows up clearly on live trading view charts, where the descending channel and today's breakout candle sit side by side.
We would want two or three more sessions of trading above the EMA before calling this a confirmed reversal. One green candle does not undo four months of a downtrend, no matter how good it looks on a chart.
RedStone Weekly Technical Chart Analysis
Zooming out to the weekly timeframe changes the picture, and not in a comforting way.
RED remains inside a much larger falling wedge structure, a pattern where both the upper and lower trendlines slope downward but converge toward each other. This one started forming after the token's early rally toward $0.90 last year, followed by a false breakout above $0.70 that failed almost immediately.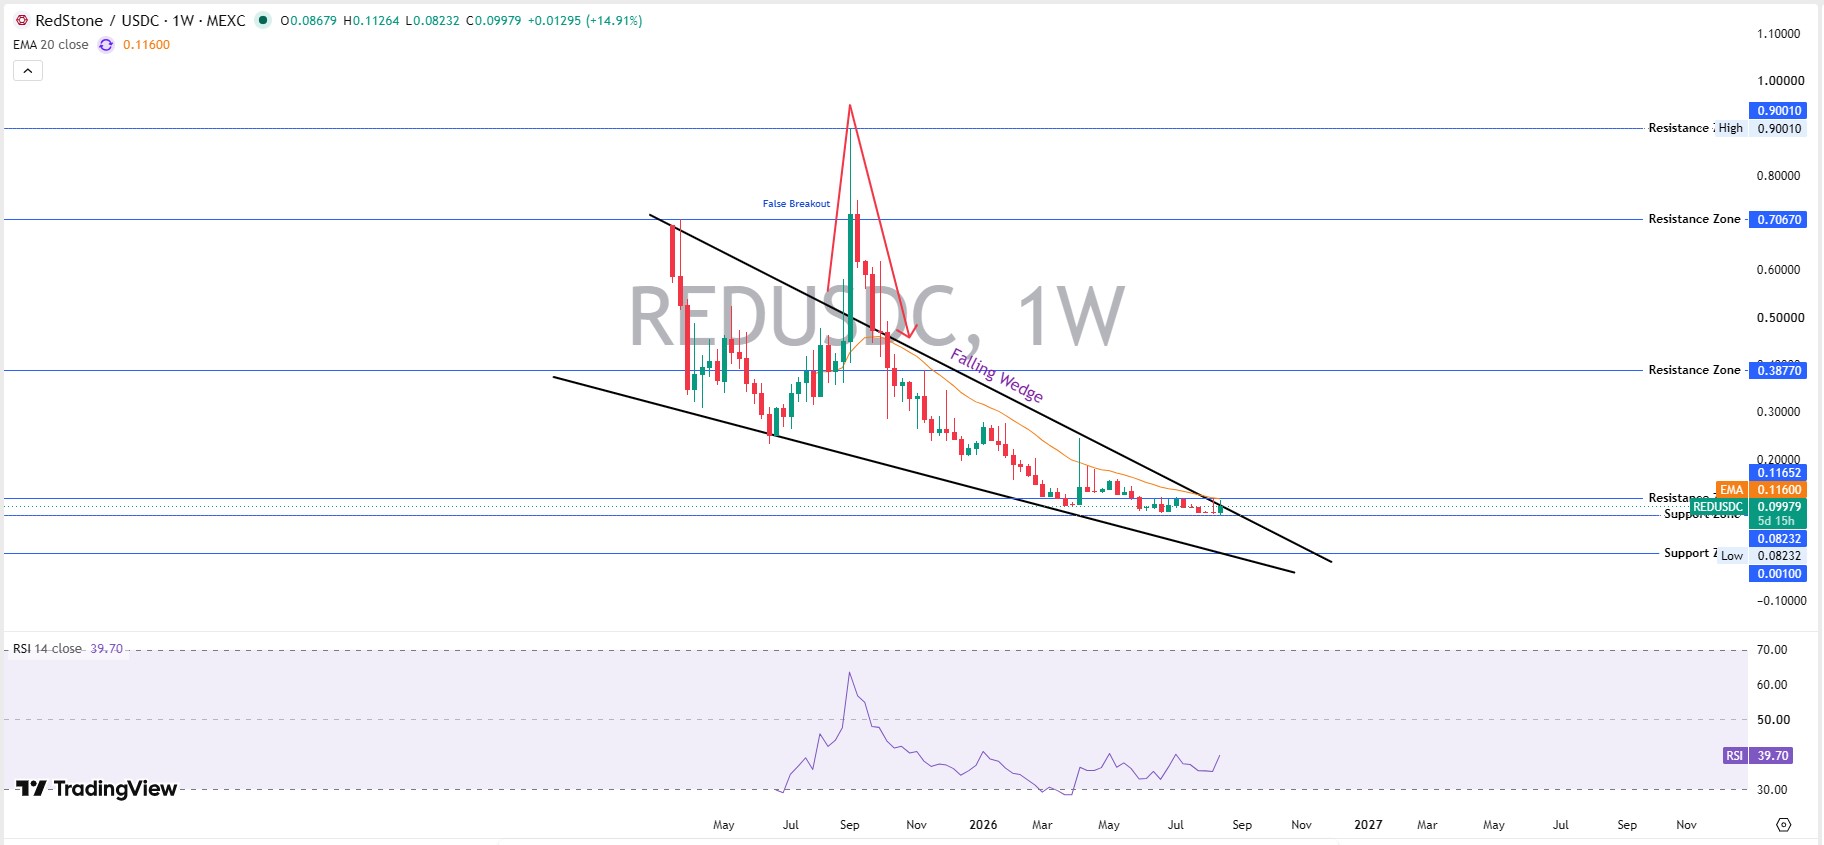
Weekly RSI reads 39.70, still under the neutral 50 line that separates bullish and bearish momentum on this timeframe.
Basically, the daily chart looks constructive while the weekly chart still looks weak, and that mismatch is exactly why traders should stay cautious.
Short-term traders can work with today's momentum. But anyone thinking long-term needs the weekly trend to actually turn, ideally with a weekly close back above the falling wedge's upper trendline, before treating this as anything more than a bounce.
This week's bounce barely registers against that scale. It's a blip inside a much bigger downtrend that has been running for over a year. Broader market direction matters here too, and tracking Bitcoin price trend alongside RED helps separate a coin-specific bounce from a market-wide one.
Tokenomics, Whales, and Liquidity
Here's the part most RedStone price prediction content skips over.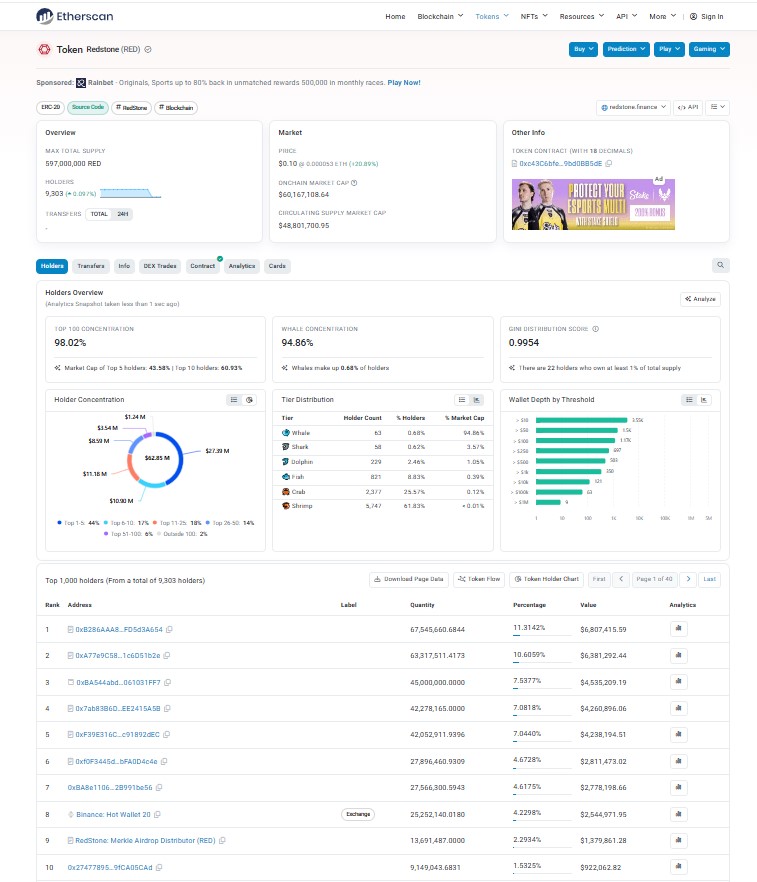
Per Etherscan holder data , the top 100 wallets control 98.02% of circulating supply, and whale-tagged wallets alone make up 94.86% of holders' total value.
The Gini distribution score, a measure of supply inequality where 1.0 is total concentration, sits at 0.9954. Twenty-two wallets each hold at least 1% of the supply, and the largest single wallet controls 11.31%, worth close to $6.8 million.
Not all of that is a red flag alone; some large wallets are exchange or vesting addresses rather than individuals looking to dump. But traders should size positions with that in mind. RedStone's post-listing trading pattern gets more context in this post-listing performance breakdown covering the Binance and MEXC period.
Liquidity also deserves a look. CoinGlass shows 24-hour liquidations near $538,000, split fairly evenly between long and short, pointing to two-sided volatility. Binance carries the biggest share of volume at roughly $80 million, with Bybit second near $14.36 million.
Altcoin Market Context for RED
RED trades as part of the broader altcoin category, and altcoins as a group have been choppy through most of 2026.
When Bitcoin dominance rises, smaller-cap altcoins like RED tend to underperform, roughly what happened through the descending channel phase. But altcoin rotations can flip fast.
A single sector narrative, oracle infrastructure, and RPC partnerships here can pull capital toward one token even while the wider altcoin market stays flat. That looks like part of what happened.
Broader altcoin price forecasts offer useful context for how RED compares against similar small-cap tokens right now.
RedStone Price Prediction: Bear, Base, and Bull Scenarios
The table below lays out three scenarios across three timeframes, with probability weighting and invalidation levels.
| Timeframe | Bear Case | Base Case | Bull Case | Probability | Invalidation |
|---|---|---|---|---|---|
| 7 Days | $0.082–$0.090 | $0.100–$0.117 | $0.117–$0.137 | Bear 30% / Base 45% / Bull 25% | Daily close below $0.08232 |
| 30 Days | $0.070–$0.082 | $0.105–$0.137 | $0.137–$0.170 | Bear 30% / Base 45% / Bull 25% | Daily/weekly acceptance below $0.070 |
| Early 2027 | $0.050–$0.070 | $0.137–$0.200 | $0.200–$0.300 | Bear 25% / Base 45% / Bull 30% | Sustained loss of the major $0.070 support zone |
Momentum around fresh exchange listing news could shift these odds quickly if a major venue adds new RED trading pairs.
Key Risks and Invalidation Levels
Extreme whale concentration remains the single biggest structural risk here. A large wallet moving even a fraction of its holdings to an exchange could pressure trading, given the thin liquidity relative to fully diluted value.
The weekly downtrend has not been broken. Until it is, every bounce carries reversal risk.
Unlock schedules or treasury movements, if any exist beyond what's disclosed, remain a variable this piece cannot fully verify without RedStone's own vesting documentation. Keeping an eye on the upcoming coin events list is a simple way to catch scheduled unlocks or announcements before they hit the chart.
Watch $0.08232 support; that's what separates a healthy pullback from a failed breakout.
Conclusion
RedStone price prediction setups right now hinge on one thing: whether trading can hold above the $0.09 EMA for more than a couple of sessions.
The catalyst looks legitimate, an infrastructure milestone paired with growing social attention. But the weekly chart hasn't confirmed a trend change, and whale concentration keeps this token higher-risk than its market cap suggests.
Watch $0.08232 on the downside and $0.11652 on the upside. Everything else is noise until one of those levels breaks. For readers tracking multiple small-cap plays at once, the crypto airdrops tracker is worth a bookmark alongside this kind of setup.
Disclaimer
This article is for informational purposes only and is not financial or investment advice. Crypto markets are highly volatile. Always do independent research and consult a licensed advisor before making any investment decisions. Forecast scenarios do not guarantee future results.
Also read:







.webp)








