Hedera Price Prediction: Bullish Setup Could Push HBAR 18%


Hedera has been quietly setting up one of its more interesting charts in weeks.
Hedera price prediction outlook just got sharper after the price carved out a bullish engulfing candle right near a multi-month descending trendline, and the next couple of daily closes could decide whether this turns into a real trend shift or just another bounce inside a longer downtrend.
The levels discussed reflect the daily timeframe and should be rechecked once the current candle closes, since the setup is still developing at the time of writing.
HBAR Market Snapshot
Price is trading at $0.06581, up 0.26% over the past 24 hours.
Futures volume over the same period stands at $60.91M against spot volume of $9.48M, which shows derivatives traders are more active than spot buyers right now, though the gap is narrower than what is typically seen on more speculative altcoins.
Open interest sits at $102.70M on a market cap of $2.87B, while circulating supply is 43.83B out of a total and max supply of 50.00B HBAR.
The relatively contained futures-to-spot ratio suggests the current move is not purely a leverage-driven spike, which adds some credibility to the bullish engulfing pattern forming on the daily chart.
Source: CoinGlass, August 18, 2026.
Methodology and Data Sources
This HBAR price prediction is built from the HBAR/USDT perpetual contract on Binance, viewed on the 1-day timeframe through TradingView.
All support and resistance levels referenced here come directly from marked swing highs and swing lows on that chart, along with the trendline drawn across the recent lower highs, not from any independently calculated indicator.
Market data is sourced from CoinGlass, and liquidation figures are pulled from CoinGlass's Hedera liquidation tracker.
The forecast horizon covers the near term, roughly the next several daily candles, and will need revisiting once the current candle closes.
HBAR Liquidation Data Today
Long-side liquidations have led to every timeframe tracked, though the totals remain modest compared to more volatile altcoins.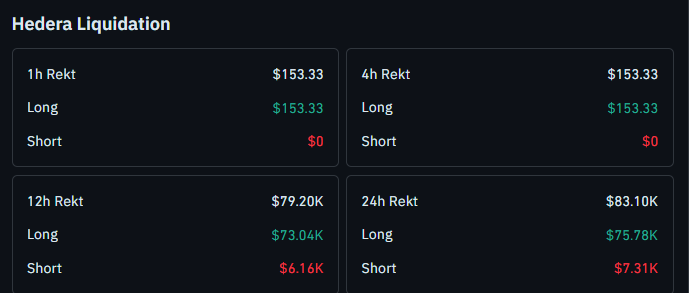
Over the past hour and the past 4 hours, long-side liquidations were identical at $153.33 each, with zero short-side liquidations recorded in either window.
Over 12 hours, long-side liquidations reached $73.04K against $6.16K in short-side liquidations, and the 24-hour total came to $83.10K in combined liquidations, with $75.78K from long positions and $7.31K from shorts.
The consistent lean toward long-side liquidations shows some leveraged buyers have been shaken out on recent dips, but the small dollar amounts relative to HBAR's market cap suggest this is not a market under heavy forced selling pressure.
Source: CoinGlass, Hedera liquidation data, August 18, 2026.
HBAR ETF Flow Update
A fresh data point worth factoring into this HBAR price forecast comes from the spot HBAR ETF market.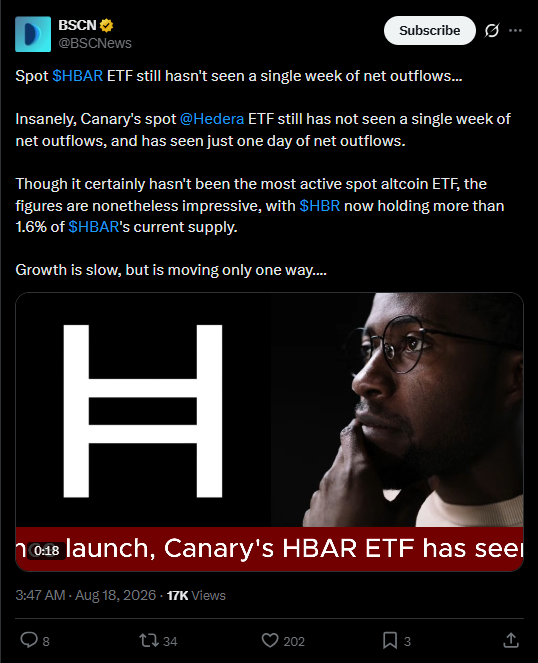
According to a post from BSCNews dated August 18, 2026, Canary's spot Hedera ETF has not recorded a single week of net outflows since launch, with only one single day of net outflows across its entire trading history so far.
The post notes this has not been the most actively traded spot altcoin ETF, but the consistency stands out, with the ETF now holding more than 1.6% of HBAR's total circulating supply.
Steady, uninterrupted inflows into a spot product are generally read as a sign of sustained institutional or long-term holder demand, separate from the short-term swings visible on the daily chart.
This adds a mildly supportive backdrop to the technical setup, even though ETF flows and daily price action do not always move in lockstep.
Source: BSCNews on X, August 18, 2026.
HBAR Technical Analysis: Bullish Engulfing Near Trendline Support
HBAR has spent a long stretch getting repeatedly rejected from a descending trendline that connects its lower highs going back to July.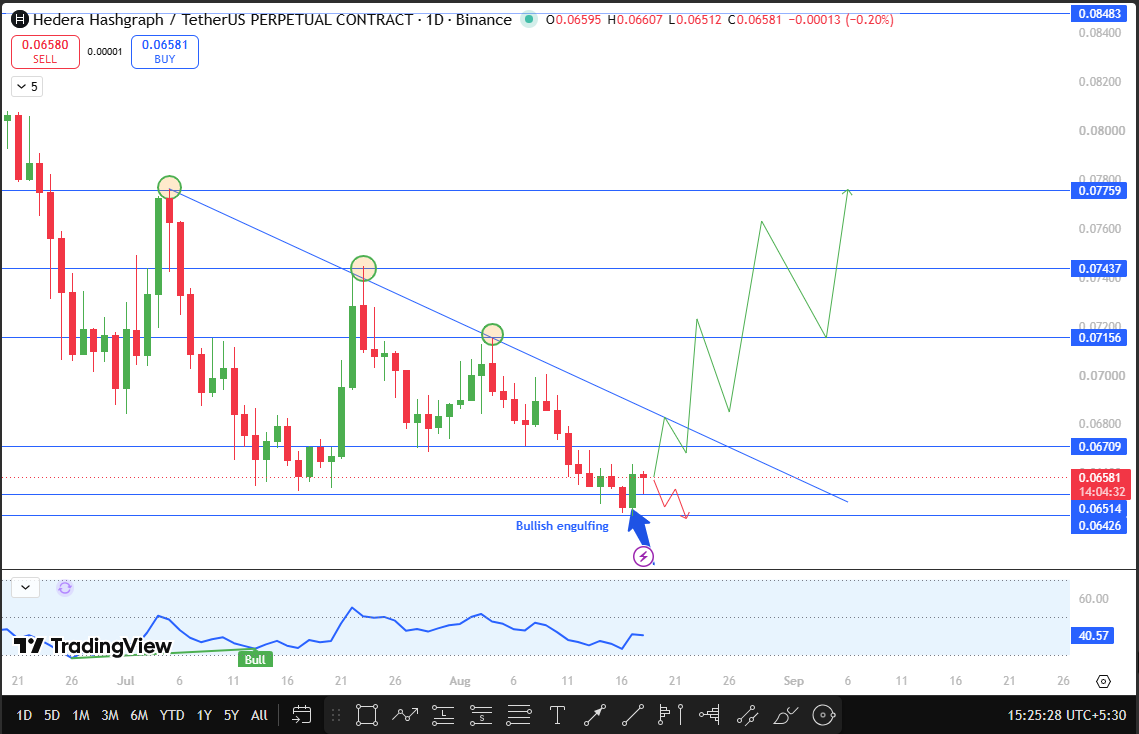
Each retest of that trendline was followed by another leg down, and price has been grinding lower within that structure for weeks.
What makes the current setup different is the candle that just printed near the bottom of this range.
HBAR formed a bullish engulfing candle, where a strong green candle fully swallowed the prior red candle's range, a pattern that often signals buyers stepping in aggressively after a period of selling exhaustion.
This candle sits close to the lower boundary of the recent price band, which adds some weight to the signal.
The chart's built-in momentum tag currently reads Bull at 40.57, sitting in the middle of its range, neither strongly bullish nor bearish, which fits a market that is at an early decision point rather than already trending.
Two scenarios follow from here. If HBAR breaks above, closes, and then sustains above $0.06709, that would represent a genuine breakout above the recent structure and the descending trendline zone, opening the path toward the resistance levels below.
If instead HBAR breaks and closes below $0.06514, the bullish engulfing signal would be undermined, and the next support to watch becomes the low of that same engulfing candle at $0.06426.
HBAR Support and Resistance Levels
Type | Level | % From CMP | Note |
Resistance 3 (Major) | $0.07759 | +17.9% | Old swing high, trendline origin zone |
Resistance 2 | $0.07437 | +13.0% | Old swing high |
Resistance 1 (Near-term) | $0.07156 | +8.7% | Old swing high |
Key Trigger / Flip Zone | $0.06709 | +1.9% | Breakout confirmation level |
Support 1 | $0.06514 | -1.0% | Breakdown trigger |
Support 2 | $0.06426 | -2.4% | Low of a bullish engulfing candle |
HBAR Risk-Reward Table
Case | Trigger | Target |
Bullish | Daily close above $0.06709 with sustained hold above it | $0.07156, then $0.07437, then $0.07759 |
Bearish | Daily close below $0.06514 with no reversal | $0.06426 |
What Would Change This HBAR Price Prediction?
The immediate trigger to watch is a confirmed daily close above $0.06709 followed by a hold on the next session, which would validate the bullish engulfing candle as a genuine reversal signal rather than a temporary bounce.
On the other hand, a daily close below $0.06514 would weaken that bullish case significantly and shift attention to whether $0.06426 holds as support.
Continued net inflows into the spot HBAR ETF would also be worth monitoring as a slower-moving but supportive signal alongside the daily chart.
Risk Considerations
Even with liquidation totals staying relatively contained, leveraged positioning can still amplify moves around key trendlines and support levels like these.
There is a risk of a false breakout above $0.06709 if buying momentum fades quickly, just as there is a risk of a false breakdown below $0.06514 if the bullish engulfing buyers step back in.
Traders using leverage around these levels should size positions with that volatility in mind.
Bull, Base, and Bear Case
Bull Case: HBAR closes and sustains above $0.06709, confirming the bullish engulfing reversal and opening a path toward $0.07156, $0.07437, and eventually the major resistance at $0.07759.
Base Case: HBAR consolidates between $0.06514 and $0.06709 for the next few sessions while the market waits for a decisive daily close in either direction.
Bear Case: HBAR closes below $0.06514 without reclaiming it, pulling price down to retest the bullish engulfing candle's low at $0.06426.
Glossary
CMP: Current Market Price, the live trading price of an asset at the time of writing.
Open Interest: The total value of outstanding futures or perpetual contracts that have not yet been settled or closed.
Liquidation: The forced closure of a leveraged trading position when losses reach a level the exchange requires to protect against further losses.
Perpetual Futures: A type of derivative contract that tracks an asset's price without an expiry date, commonly used for leveraged trading.
Bullish Engulfing Candle: A two-candle pattern where a larger green candle fully covers the body of the prior red candle, often read as an early sign of buyers regaining control.
Disclaimer
This article is for informational purposes only and does not constitute financial advice. Cryptocurrency markets are highly volatile, and prices can move sharply in either direction. CoinGabbar and the analyst do not hold a position at the time of publication. Readers should conduct their own research and consult a qualified financial advisor before making any investment decisions.







.webp)








