Riot Platforms Price Prediction: RIOT Jump, $9.1 Billion Deal, Q2 Loss


RIOT is exploding higher, and traders are rushing in fast after one of the biggest headlines in the Bitcoin mining sector this year.
This Riot Platforms price prediction lands right as a massive AI data center deal sends the tokenized stock surging, even as the company posted a wider quarterly loss.
Over the next one to two weeks, the bullish case builds as long as RIOT holds above $19.488, while the $24.934 zone stands as the next real test for continuation.
With volume, market cap, and price all spiking together, here's what the news and the chart show.
Market data was checked on August 11, 2026, at 16:15 IST.
Riot Platforms Price Prediction Today: Market Overview
Metric | Value |
Price | $23.085 |
24h Change | +20.12% |
Market Cap | $8.8B |
24h Volume | $17.79M |
Avg. Tokenized Price | $23.49 |
Tokenized Price Difference | +$0.1479 (+0.63%) |
Tokenized Market Cap | $514.92K (+14.08%) |
Tokenized 24h Volume | $315.95K (+38.99%) |
Issuer | Ondo Assets |
Source: Data from CoinMarketCap as of August 11, 2026, at 16:15 IST. Figures may vary slightly across other tracking websites.
Riot Platforms News: $9.1 Billion Anthropic Data Center Deal
A post from Bull Theory reported that Anthropic has struck a $9.1 billion deal with Riot Platforms, a Bitcoin miner that recently began selling AI data center capacity. 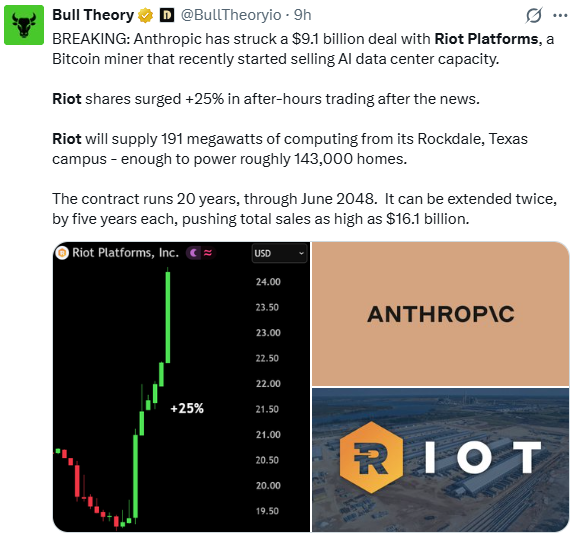
According to the post, Riot shares surged 25% in after-hours trading following the news, with the company set to supply 191 megawatts of computing power from its Rockdale, Texas campus, described as enough to power roughly 143,000 homes.
The contract is reported to run 20 years through June 2048, with two possible five-year extensions that could push total contract value as high as $16.1 billion.
Note: CoinGabbar could not independently verify the full deal terms beyond what's stated in this post, so these figures should be treated as reported rather than confirmed.
Riot Platforms News: Q2 Net Loss Alongside Deal Announcement
A separate post from The Block reported that Riot Platforms posted a $237.2 million second-quarter net loss, even as revenue rose 14% to $174.2 million. 
Source: Data From X
The same report noted RIOT shares jumped more than 10% after hours as the company unveiled its 20-year, $9.1 billion data center deal with what was described as an unnamed AI lab at the time.
Combined with the earlier Anthropic report, the market appears to be looking past the quarterly loss and focusing on the long-term revenue potential from the new contract.
$Riot Platforms Price Prediction Chart: Technical Analysis
Pair: $RIOT/USD (Tokenized Stock via Ondo) · Market: Crypto (Tokenized Equity) · Exchange: TradingView Crypto Index · Timeframe: 4H · Source: TradingView · Timestamp: August 11, 2026, 16:15 UTC+5:30
$RIOT is trading at $23.085. The bigger picture is a descending trendline that had capped the price since late June, which price broke through strongly on the recent spike.
A bullish EMA crossover is marked on the chart where the EMA 20 crossed above the EMA 50, confirming the shift in short-term momentum.
The EMA 20 sits at $21.597 and the EMA 50 at $21.287, both now well below current price after the breakout.
RSI is reading 63.37, firmly on the bullish side of neutral without being stretched into overbought territory yet.
Currently, the price is taking a pullback at the trendline. If the price wants to move higher, it needs to break the current resistance, and then we can see the upper levels for an uptrend. 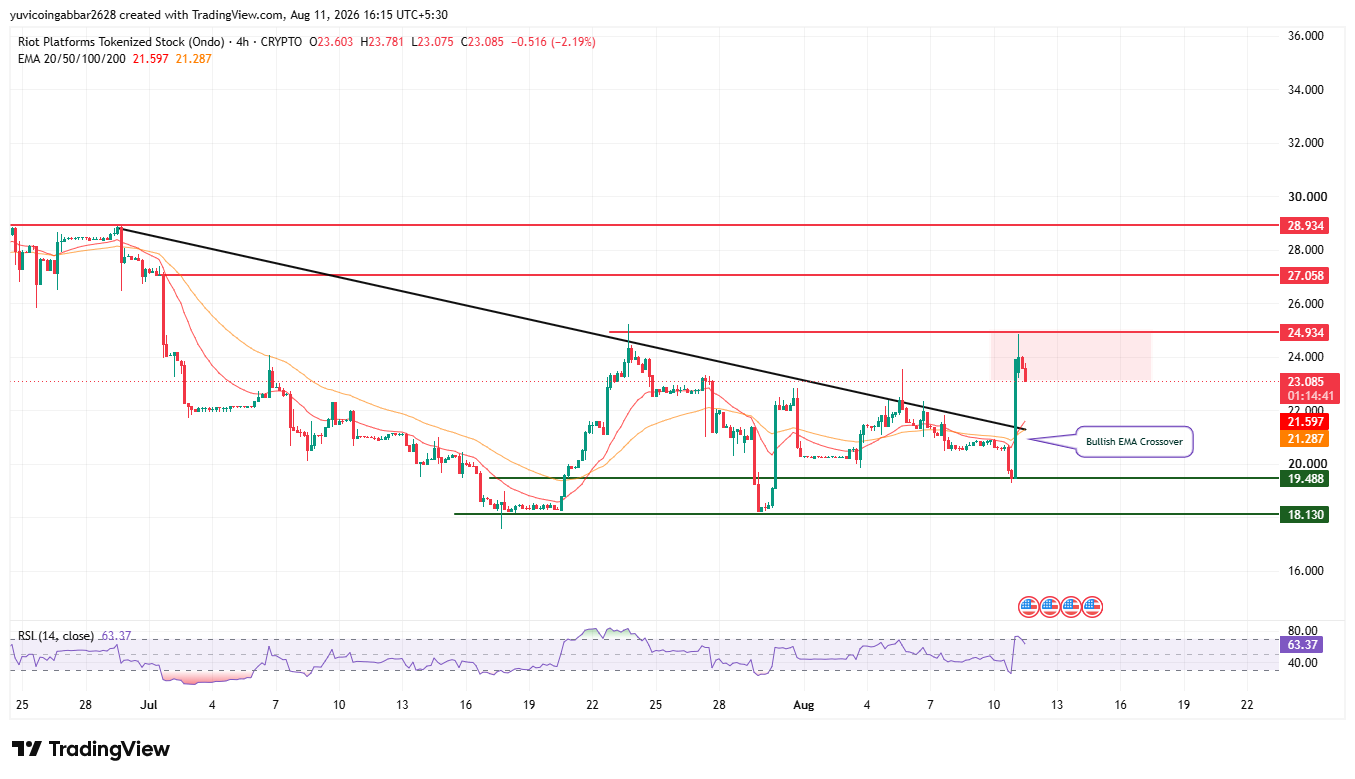
Support and Resistance Levels
Level Type | Price |
Resistance 3 | $28.934 |
Resistance 2 | $27.058 |
Resistance 1 (nearest) | $24.934 |
Immediate Price Reference | $23.085 |
First Confirmed Support | $19.488 |
Structural Floor | $18.130 |
EMA Levels
EMA | Price |
EMA 20 | $21.597 |
EMA 50 | $21.287 |
$Riot Platforms Forecast: Bull Case vs. Bear Case
$RIOT price target 2026 Bull case: Holding above the EMA cluster near $21.287 to $21.597 and $19.488 below it keeps the breakout intact.
A confirmed close above the nearest resistance at $24.934 would open the path toward $27.058 and then $28.934, especially with the Anthropic deal continuing to draw fresh attention.
$RIOT price target 2026 Bear case: A drop back below the EMA cluster near $21.287 would put the breakout in doubt and suggest the news-driven spike is fading.
Losing $19.488 would expose the structural floor at $18.130 as the next downside level.
$RIOT price target 2026: Can RIOT Reach $28.934?
$28.934 is the highest resistance level marked on the chart. Getting there would require $RIOT to first clear the nearest resistance at $24.934, then push through $27.058 before testing $28.934.
That's a multi-stage move rather than a single leg and would likely need continued positive developments around the Anthropic contract to sustain the momentum.
What Could Invalidate the Bullish Setup?
A rejection at $24.934 followed by a close back below the EMA cluster near $21.287 to $21.597 would call the breakout into question.
A deeper break through $19.488 down to the $18.130 structural floor would undo the recent recovery and suggest the initial deal-driven surge has fully unwound.
Riot Platforms Price Prediction: Expert View
According to CoinGabbar analysts, the combination of a confirmed trendline break and a bullish EMA crossover lines up cleanly with the scale of the Anthropic news, and a 20-year, multi-billion dollar contract is the kind of catalyst that can shift sentiment well beyond a single trading session.
RSI at 63.37 shows strong momentum without being overextended yet. The wider quarterly net loss is a real number worth noting, but the market's reaction so far suggests traders are pricing in the long-term revenue potential of the deal over near-term earnings.
The $21.287 to $24.934 range is the zone to watch next: clearing it with volume would confirm the breakout has legs, while losing the EMA cluster would put the move back in question.
Riot Platforms Price Prediction: Data Sources
Price and EMA data referenced from a 4H RIOT/USD tokenized stock chart via TradingView, timestamped August 11, 2026, 16:15 UTC+5:30.
Market cap, volume, and tokenized asset data referenced from a stock and tokenized-asset tracker, with issuance via Ondo Assets.
Anthropic deal details reported via a post from Bull Theory on X. Q2 earnings and deal confirmation reported via a post from The Block on X.
Disclaimer: This piece is for informational purposes only and isn't financial advice. The levels and scenarios above are based on technical chart analysis and publicly available data at the time of writing, and both crypto and tokenized equity markets can move sharply within hours, so past patterns don't guarantee future outcomes. It's worth doing independent research and considering your own risk tolerance before acting on any of the levels discussed here.

















