Official Trump Price Prediction: $TRUMP Could Spark a Mega Rally


Official Trump launched in January 2025, arriving on Solana just ahead of a major political event, and it drew massive attention almost instantly.
Today it trades at $1.50, up 0.4% on the day, a fraction of where it started given the coin's volatile early run.
This official Trump price prediction looks at a token with 248.251M circulating out of a 1B max supply, meaning a large chunk of tokens is still set to enter the market over time.
That kind of supply overhang tends to matter for long-term price behavior, separate from whatever the charts show in the short term.
$TRUMP Live Market Data
TRUMP is currently trading at $1.50, up 0.4% over the last 24 hours. Today's range has moved between $1.48 and $1.54.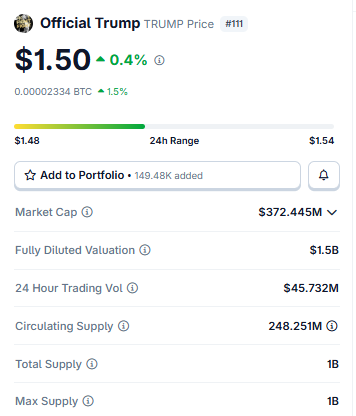
Source: Liquidation Data Taken From Coinglass.
Zoom into the 12-hour window, though, and shorts took the bigger hit at $138.55K versus $43.48K in longs.
Shorter windows flip the story again; both the 1-hour and 4-hour periods show liquidations entirely on the long side. Mixed signals here suggest traders are genuinely split on direction right now.
Exchange Volume
Binance dominates $TRUMP volume at $30.64M, well ahead of OKX at $20.65M. Bybit follows at $7.95M, with Bitget and Gate contributing $3.21M and $3.04M. 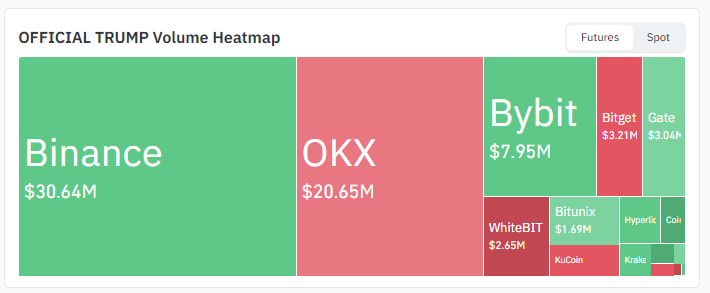
Source: Volume Heatmap Data Taken From Coinglass.
WhiteBIT, Bitunix, Hyperliquid, KuCoin, and Kraken round out smaller but steady volume across the board.
That spread keeps liquidity fairly deep for a politically themed token.
Key Takeaways
-
TRUMP sits at $1.50 right now, up 0.4% for the day.
-
The 4H chart shows price riding an ascending channel, right near the upper boundary.
-
The daily timeframe has a descending channel forming, worth keeping an eye on.
-
Longs got hit hardest in the last 12 hours; $43.48K wiped out there.
-
Binance leads trading volume by a wide margin, $30.64M and climbing.
Technical Analysis
4-Chart Analysis for $TRUMP Price Prediction
On the 4H chart , TRUMP is riding an ascending channel, and the price is currently pressing against the upper boundary.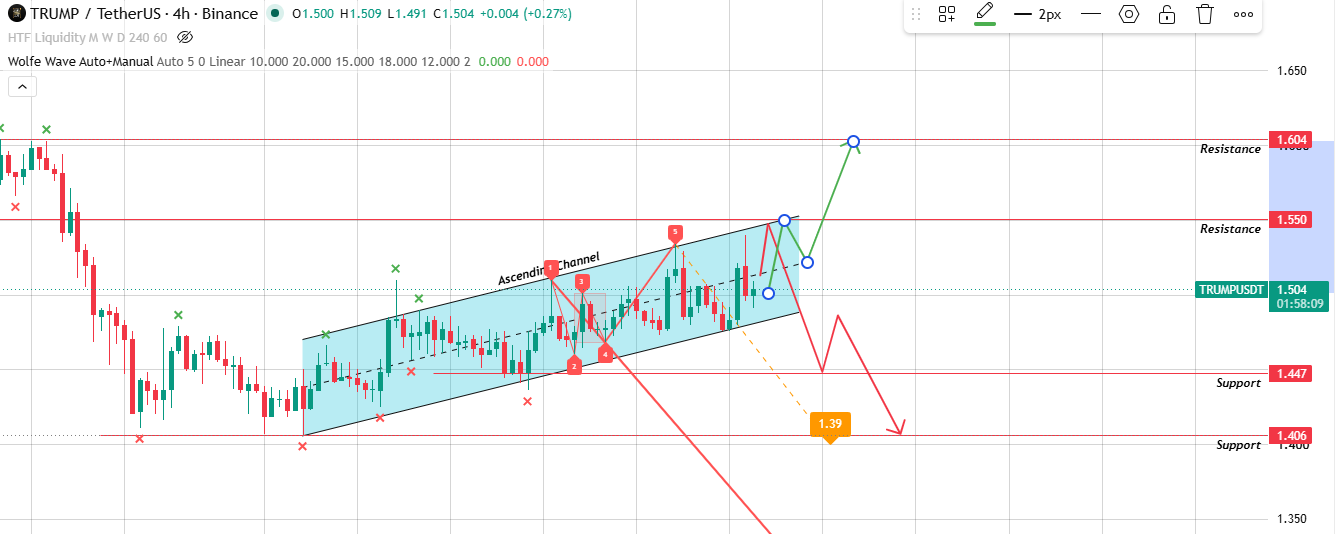
Source: Chart Taken From TradingView.
Break through that with volume, and $1,550 opens up first, then $1,604.
But if the price gets rejected here instead, it likely slides back to the lower boundary, and a breakdown there sends it toward $1.447 and then $1.406.
The Wolfe Wave indicator on this chart backs up that bearish path too, pointing to similar lower levels if the channel breaks down.
Daily Chart Analysis for $TRUMP Price Prediction
The daily chart tells a slightly different story; a descending channel is forming here. 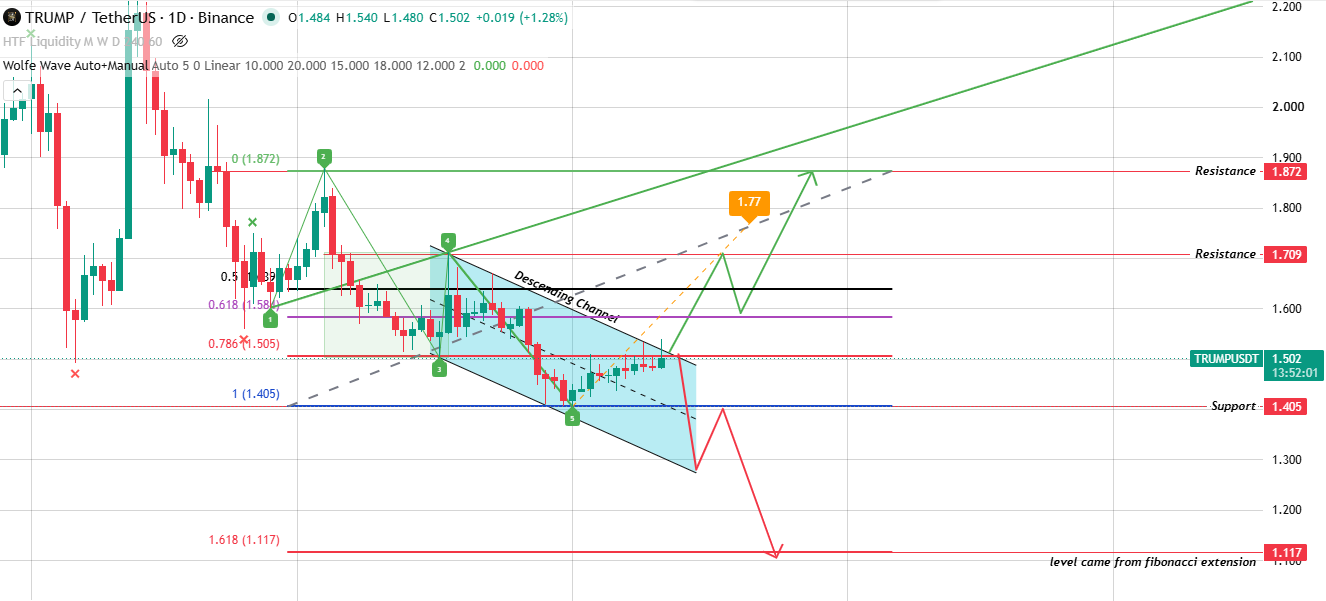
Source: Chart Taken From TradingView.
A break above its upper boundary, confirmed by the Wolfe Wave pattern, targets $1.709 first, then $1.872.
If the price instead gets rejected and breaks the channel's lower boundary, the drop could extend all the way to the 1.618 Fibonacci extension at $1.117.
Two different structures on two timeframes, but both hinge on how price reacts at these boundaries.
Bull / Base / Bear Case
Glossary
Ascending Channel: picture price grinding upward, boxed in by two parallel lines both sloping up, and it keeps going until one side finally gives way.
Descending Channel: basically the mirror image, the price sliding lower between two downward-sloping lines instead.
Wolfe Wave: Traders lean on this one to catch potential reversal points, though it usually works best paired with other patterns for confirmation.
Liquidation: your leveraged position runs dry on margin, and the exchange just shuts it down; no negotiation there.
Fibonacci Extension: a way of guessing how far a price could travel once it moves past a previous swing high or low.
Methodology
Every level in this official Trump price prediction comes from TradingView chart data on the 4H and 1D timeframes, including Wolfe Wave and Fibonacci extension readings. Liquidation and volume numbers are sourced from Coinglass. Nothing here goes beyond what's actually shown on the charts.
Disclaimer: This article is for informational purposes only and should not be treated as financial advice. Cryptocurrency markets are highly volatile, and prices can change quickly. Always do your own research and consult a financial advisor before making investment decisions.

















