PAX Gold Price Prediction: $PAXG Breaks Out, Eyes $5K Soon, Upcoming?


PAXG is climbing back into focus, and gold-backed token buyers are watching the chart closely.
This PAX Gold price prediction comes right as PAXG confirms a bullish EMA crossover after weeks of sideways trading, with price now pushing against former resistance near $4,319.
Over the next one to two weeks, the bullish case builds as long as PAXG holds above $4,197.83, while a slip back into the old range would put the recovery on pause.
With liquidations leaning short and volume climbing, here's what the chart and derivatives data show.
Market data was checked on August 11, 2026, at 13:45 IST.
PAX Gold Price Prediction Today: Market Overview
Metric | Value |
Price | $4,361.45 |
24h Change | +1% |
Market Cap | $1.9B |
FDV | $1.9B |
24h Volume | $232M |
Vol/Mkt Cap (24h) | 12.23% |
Liquidity/Mkt Cap | 1.02% |
Total Supply | 436.55K PAXG |
Max Supply | Infinite |
Circulating Supply | 436.55K PAXG |
Holders | 85.92K |
Source: Data from CoinMarketCap as of August 11, 2026, at 13:45 IST. Figures may vary slightly across other tracking websites.
PAX Gold Liquidation and Volume Data
This section covers futures market data from Coinglass, kept separate from the spot volume figures above.
Liquidations (Long vs. Short)
Timeframe | Total | Long | Short |
1h | $1.60K | $1.60K | $0 |
4h | $12.61K | $12.61K | $0 |
12h | $105.56K | $12.61K | $92.95K |
24h | $148.41K | $16.79K | $131.63K |
Short liquidations dominate the 12h and 24h windows, suggesting traders betting against the recovery have been getting squeezed as PAXG pushed higher, while the 1h and 4h windows show longs taking the more recent hit as price cooled off slightly.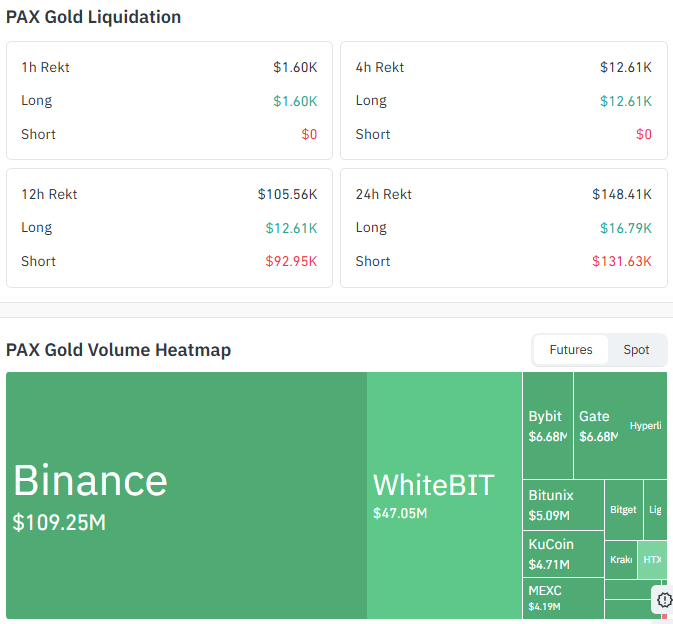
Source: Data From CoinGlass
Futures Volume by Exchange
Exchange | Volume |
Binance | $109.25M |
WhiteBIT | $47.05M |
Bybit | $6.68M |
Gate | $6.68M |
Bitunix | $5.09M |
KuCoin | $4.71M |
MEXC | $4.19M |
Binance and WhiteBIT together account for the large majority of tracked futures volume, with the rest spread thinly across smaller exchanges.
PAX Gold Price Prediction Chart: Technical Analysis
Pair: PAXG/USD · Market: Spot (Crypto) · Exchange: TradingView Crypto Index · Timeframe: 1D · Source: TradingView · Timestamp: August 11, 2026, 13:45 UTC+5:30
PAXG is trading at $4,361.45, after spending most of July and early August consolidating in a range roughly between $3,982.27 and $4,197.83.
Price broke out of that range in early August and has continued climbing since, with a bullish EMA crossover marked on the chart where the $EMA 20 crossed above the $EMA 50, confirming the shift in short-term trend.
The $EMA (Exponential Moving Average, an indicator that tracks the average price over a set number of candles and reacts faster to recent price moves) 20 sits at $4,197.83 and the EMA 50 at $4,171.75, both now acting as support beneath the recent breakout rather than resistance above it.
Price is currently testing the $4,319.01 zone, a level that capped the range earlier and now sits just below the current price.
If the price holds the current support, the trend remains bullish as long as it trades above the $EMA.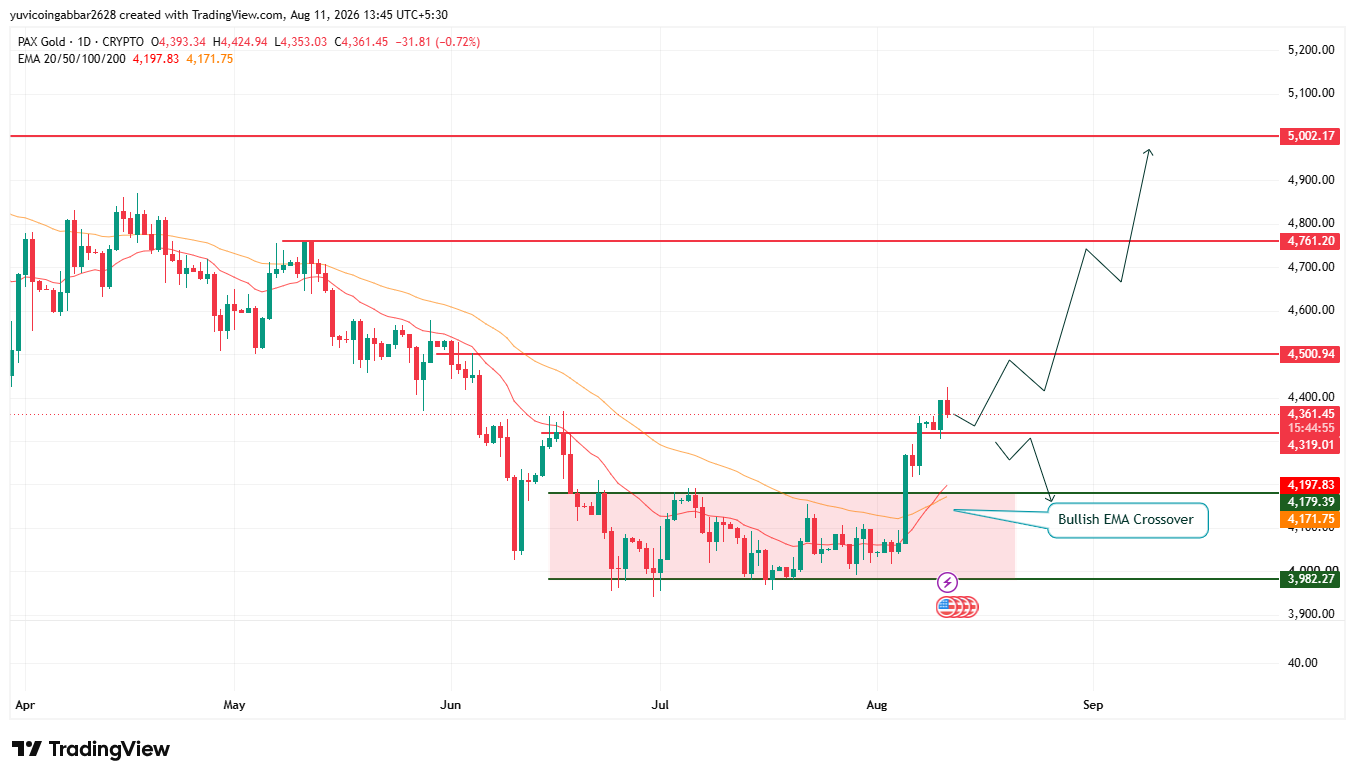
Support and Resistance Levels
Level Type | Price |
Resistance 3 | $5,002.17 |
Resistance 2 | $4,761.20 |
Resistance 1 (nearest) | $4,500.94 |
Immediate Price Reference | $4,361.45 |
First Confirmed Support | $4,319.01 |
Deeper Support | $4,179.39 |
Structural Floor | $3,982.27 |
EMA Levels
EMA | Price |
EMA 20 | $4,197.83 |
EMA 50 | $4,171.75 |
PAX Gold Forecast: Bull Case vs. Bear Case
$PAXG price target 2026: Bull case: Holding above $4,319.01 and the $EMA cluster near $4,171.75 to $4,197.83 keeps the breakout intact.
A confirmed close above the nearest resistance at $4,500.94 would open the path toward $4,761.20 and then $5,002.17.
$PAXG price target 2026: Bear case: A drop back below $4,319.01 would put the breakout in doubt and risk a return into the old $3,982.27 to $4,197.83 range.
Losing the $EMA cluster and the structural floor at $3,982.27 would suggest the bullish EMA crossover has failed.
$PAXG price target: Can $PAXG reach $5,002.17?
$5,002.17 is the highest resistance level marked on the chart.
Getting there would require PAXG to hold above $4,319.01, clear the nearest resistance at $4,500.94, and then push through $4,761.20 before testing $5,002.17.
That's a multi-stage move rather than a single leg, and each level would need to flip from resistance into support along the way.
What Could Invalidate the Bullish Setup?
A rejection at $4,319.01 followed by a daily close back below the EMA cluster near $4,171.75 to $4,197.83 would call the recent breakout into question.
A deeper slide down to the $3,982.27 structural floor would put PAXG back inside its old range and suggest the bullish EMA crossover was short-lived.
PAX Gold Price Prediction: Expert View
According to CoinGabbar analysts, the bullish EMA crossover, combined with price breaking out of a multi-week range, points to buyers taking control after a long consolidation.
Short liquidations outpacing longs over the past 24 hours suggest sellers have been caught off guard by the move, which can add fuel to further upside if the trend holds.
The $4,319.01 to $4,500.94 zone is the one to watch next: clearing it with volume would confirm the breakout is more than a short-term bounce, while losing $4,319.01 would put PAXG back into range-bound territory.
PAX Gold Price Prediction: Data Sources
Price and EMA data referenced from a 1D PAXG/USD chart via TradingView, timestamped August 11, 2026, 13:45 UTC+5:30.
Market cap, FDV, volume, and supply data referenced from a crypto market tracker (CoinMarketCap/CoinGecko-style source).
Liquidation and futures volume data referenced from Coinglass.
Disclaimer: This piece is for informational purposes only and isn't financial advice. The levels and scenarios above are based on technical chart analysis and publicly available data at the time of writing, and crypto markets can move sharply within hours, so past patterns don't guarantee future outcomes. It's worth doing independent research and considering your own risk tolerance before acting on any of the levels discussed here.

















