Saylor's Strategy Sells 3,588 Bitcoin: What It Means for BTC Price


Bitcoin Price Prediction BTC Holds Near $63K After Strategy's Big Sale
Bitcoin is trading around $63,150 as of July 7, 2026. The price bounced back after a rough week that saw BTC dip toward $58,000.
The drop came after Strategy, the company led by Michael Saylor, sold a large chunk of its bitcoin holdings. It was the firm's biggest sale ever.
What happened to Bitcoin's price this week?
Strategy sold 3,588 BTC across two batches between June 29 and July 5. The sale totaled about $216 million, and the company said the funds would go toward dividends on its Digital Credit securities.
This was roughly seven times larger than Strategy's first-ever BTC sale back in May. The news shook investor confidence since Saylor had long been seen as a bitcoin holder who would never sell.
Saylor pushed back on that idea after the sale. He said, "I never said Strategy would never sell its Bitcoin." In other words, his personal stance on holding bitcoin is different from the company's ability to sell it for business reasons, like funding dividends.
The world's largest cryptocurrency fell from near $64,600 to about $58,190 on the news. But the drop didn't last. Prices climbed back above $63,000 within days.
Strategy now holds 843,775 coins, worth roughly $53.28 billion. Its average cost per coin sits at $75,653, which means the company is sitting on paper losses at current prices.
Why didn't Bitcoin crash further?
Market watchers expected panic selling. Instead, exchange inflows dropped to their lowest point in two weeks. That usually means fewer people are rushing to sell.
President Trump also gave crypto a boost. He called himself "a big crypto guy" during a press event, adding that BTC could be considered for new Trump Accounts aimed at helping kids save money.
Social media sentiment stayed mostly negative, with about 68% bearish comments versus 29% bullish. Yet price action told a different story, since BTC actually rose after the sale was confirmed.
Is Michael Saylor's situation like Sam Bankman-Fried's?
Some traders compare Saylor's situation to the FTX collapse, though the circumstances differ.
In November 2022, CZ announced Binance would sell its FTT holdings. That sparked panic, exposed FTX's shortfall, and led to its collapse days later. It also marked the bottom of the 2022 bear market.
A similar pattern is now unfolding with Strategy. Rumors of forced selling came first, then a small 32 BTC sale, then the much larger $216 million sale.
Analysts stress Strategy isn't FTX. It still holds hundreds of thousands of bitcoin and hasn't collapsed. Some see the pattern as a warning sign, while others view it as the kind of fear that often marks a market bottom.
What is Bitcoin's key resistance level today?
The daily chart shows BTC breaking below its rising price channel for the third time in 2026. Similar breakdowns happened in February and May, and both times price recovered back into the channel.
The Parabolic SAR sits at $58,398, just under the current price, which is a short-term positive signal.
Indicator | Level |
20-day EMA | $62,651 |
50-day EMA | $65,621 |
100-day EMA | $69,302 |
200-day EMA | $75,407 |
Parabolic SAR | $58,398 |
All four EMAs sit above the current price. The 20-day EMA is the closest hurdle. Bulls need to reclaim and hold this level to argue the breakdown will resolve upward again, like it did in prior months.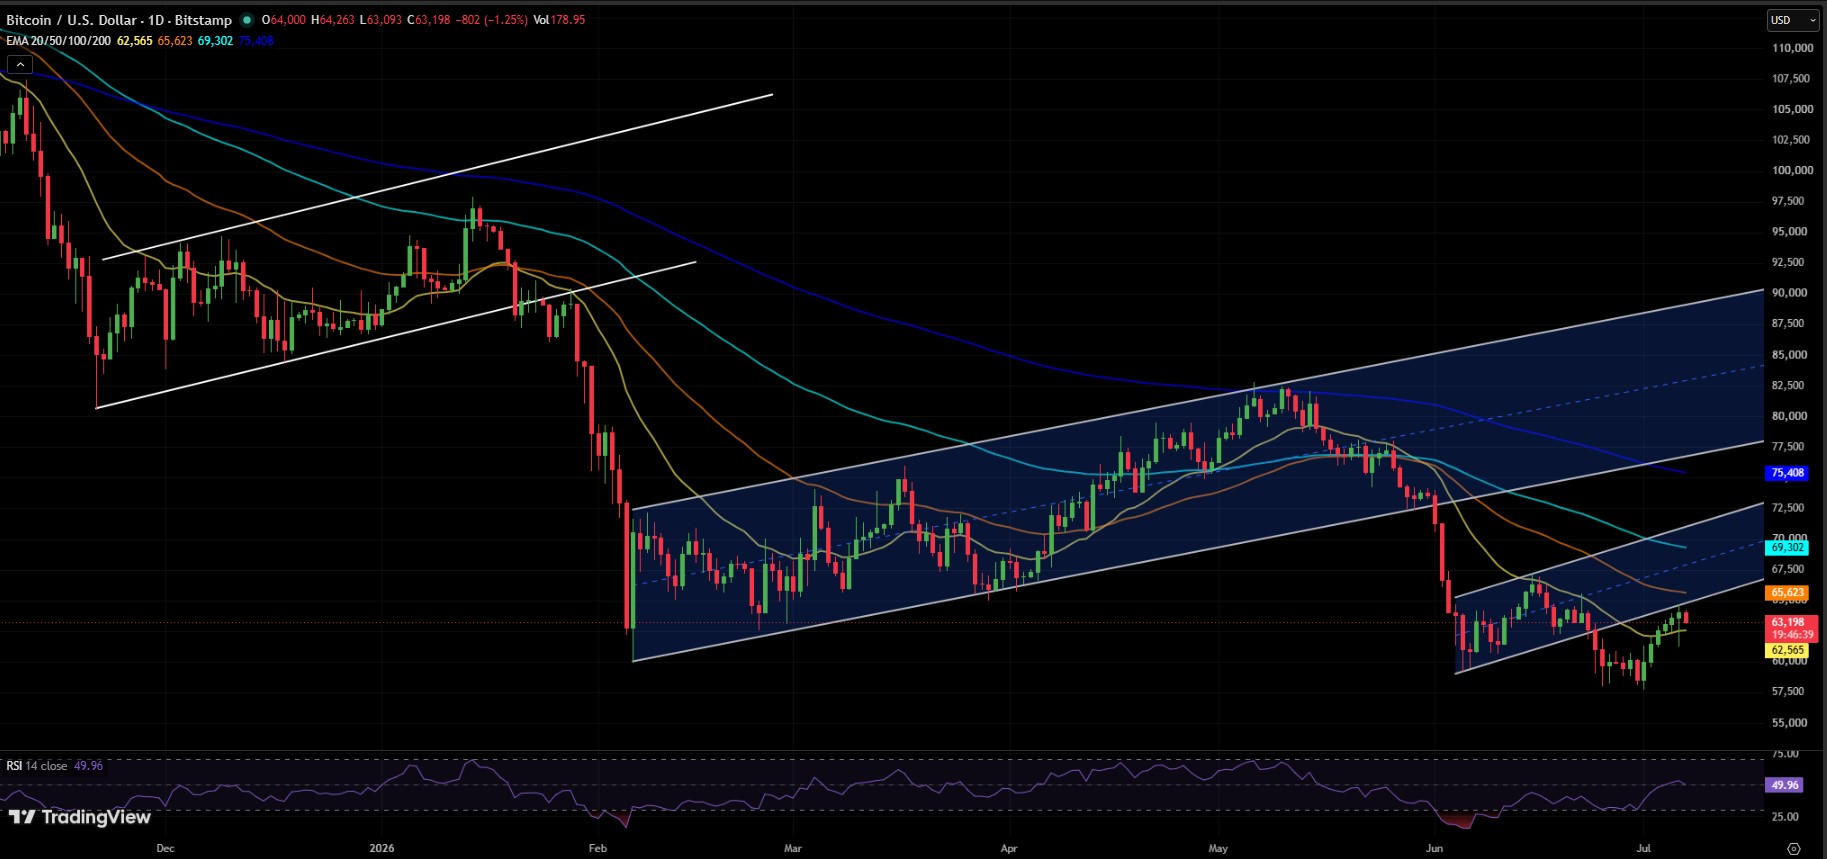
What is Bitcoin's liquidation data showing right now?
Derivatives data shows a mixed but slightly long-leaning market. Over the past 24 hours, more than 94,800 traders were liquidated, totaling around $520 million.
Timeframe | Long Liquidations | Short Liquidations |
1 hour | $3.76M | $18.44K |
4 hour | $13.84M | $430.49K |
12 hour | $20.79M | $97.60M |
24 hour | $91.79M | $148.86M |
The largest single liquidation happened on Binance in ETH/USDT, worth $11.60 million. Long/short account ratios on Binance and OKX both lean above 1.3, showing more traders are betting on a bounce than a further drop.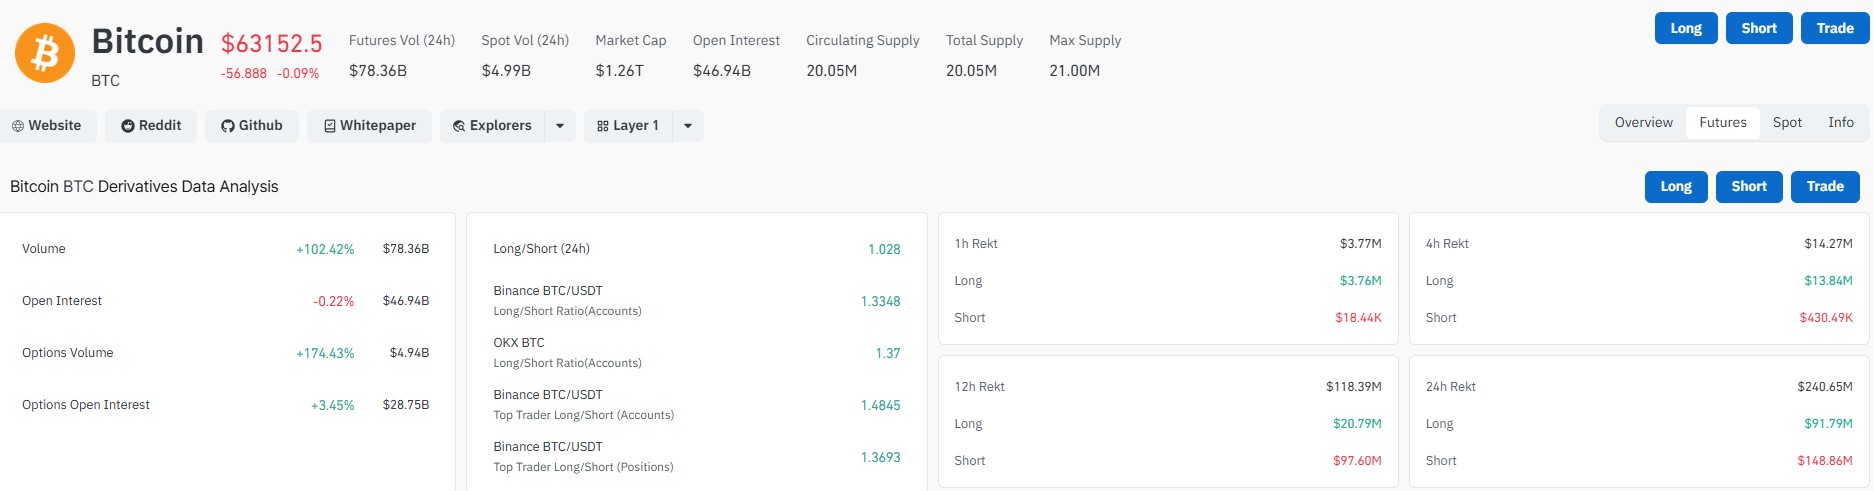
What do prediction markets say about Bitcoin in July?
Polymarket traders currently price a 71% chance BTC reaches $65,000 this month. Odds drop to 44% for $67,500 and just 24% for $70,000.
On the downside, there's a 38% chance of falling below $57,500, and a 22% chance of dropping under $55,000. The data points to a market leaning toward a modest recovery, though tail risks remain on both sides.
Will Bitcoin price go up or down next?
Bitcoin's next move likely depends on whether it can close above the 20-day EMA near $62,651. A hold above that level could open the door toward $65,000 and possibly $67,500.
A failure to reclaim it, paired with more Strategy bitcoin sales or weak macro data, could send BTC back toward the $58,000 zone tested in late June.
Disclaimer: This article is for informational purposes only and should not be considered financial or investment advice. Cryptocurrency markets are highly volatile, and prices can change rapidly. Always do your own research and consult a licensed financial advisor before making investment decisions. Past performance is not indicative of future results.
Also read:










.webp)






