Hedera Price Prediction: Can HBAR Rebound From Key Support?


Hedera's institutional tokenization story just picked up fresh attention. Five Spanish banks recently completed a tokenized deposit pilot built on the Asseto platform, developed by ioBuilders and now offered through Hashgraph.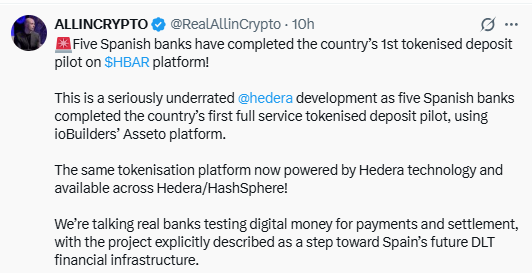
The pilot can run on either private HashSphere infrastructure or Hedera's public network, so it is not a direct HBAR adoption event, but it adds another proof point to the broader Hedera ecosystem's institutional experimentation.
The development comes at a critical moment for the Hedera price prediction, with HBAR testing an important technical support area near $0.0676.
Why HBAR Price Is Under Pressure
HBAR is down 1.24% over the past 24 hours and 4.03% over the past week, while its 90-day performance stands at -27.89%. The broader picture remains weak, with the token down 36.34% year-to-date and 73.93% over the past year.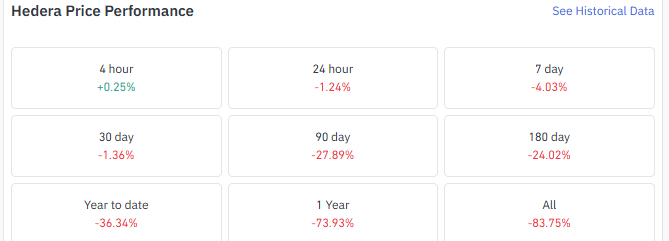
That weakness contrasts with Hedera's improving institutional tokenization narrative.
While developments around tokenized deposits strengthen the longer-term fundamental backdrop, they have yet to translate into sustained buying pressure.
For now, the 4-hour structure shows HBAR attempting to stabilize near triangle support, making the next technical move more important than the longer-term performance numbers.
Futures Traders Are Split on HBAR's Next Move
As per the Coinglass derivatives data, it shows a divided market. Binance's overall HBAR/USDT long/short ratio sits at 0.8591, below 1, pointing to a mild short lean among broader accounts.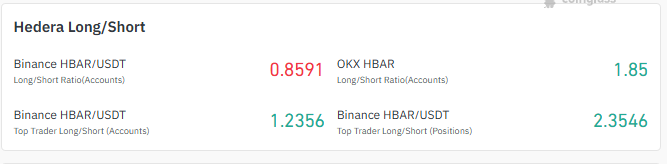
Top traders tell a different story, with Binance's top trader account ratio at 1.2356 and top trader position ratio notably higher at 2.3546. OKX accounts show a similar tilt at 1.85.
This long/short ratio divergence between broader accounts and larger traders suggests bigger players lean long, though it is not confirmed bullish sentiment until price validates it.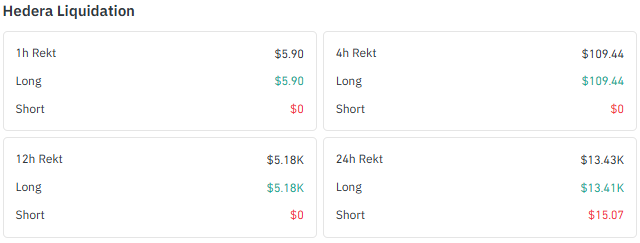
Liquidations have hit longs hardest, with roughly $13.41K in long liquidations over 24 hours versus a fraction of that in shorts.
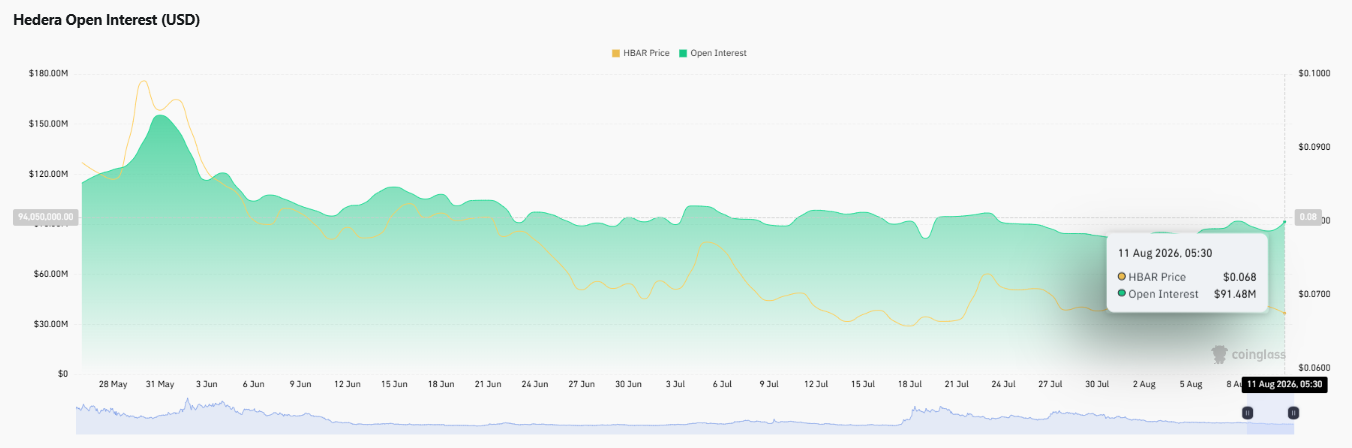
Open interest, near $91.48M, has stayed relatively stable through the weakness, showing participation has not dried up, though it offers no directional signal on its own.
Data source: coinglass
HBAR Tests Triangle Support as RSI Cools
On the TradingView 4-hour chart, HBAR is trading inside a symmetrical triangle, with the lower ascending trendline currently being tested near $0.0676.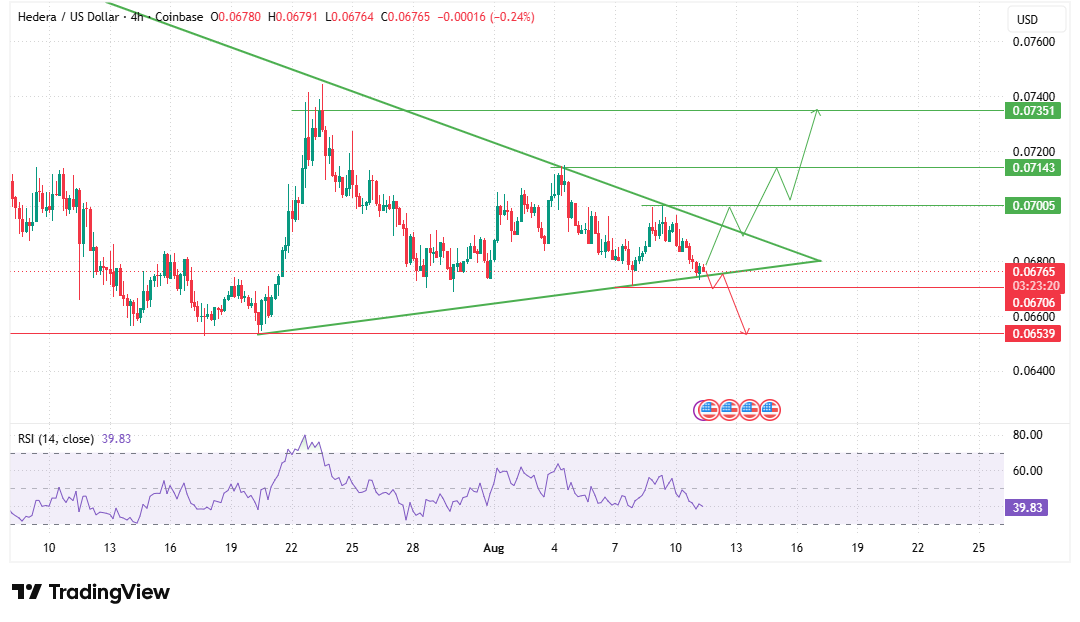
That trendline is acting as support for now, though there is no confirmed bullish reversal yet, and the descending upper trendline keeps compressing price from above.
The 4-hour RSI reads 39.83, below the neutral 50 line, reflecting weak momentum without deeply oversold conditions, leaving room for price to move either way.
If buyers step in, the first recovery target sits at $0.07005, followed by $0.07143 and a major upside level at $0.07351.
If triangle support gives way instead, the first level to watch is $0.06706, with $0.06539 next.
Until one boundary breaks with confirmation, this remains a waiting game rather than a directional call.
Data source: TradingView
Overall Technical Sentiment: Neutral
Overall technical sentiment on HBAR is Neutral. Triangle support remains intact for now, but RSI below 50 combined with soft recent performance keeps the setup from turning bullish.
Hedera Price Prediction: Three Scenarios to Watch
Scenario | Technical Trigger and Levels |
Bullish | Triangle support holds, and HBAR reclaims $0.07005, opening the path toward $0.07143 and $0.07351. |
Base | HBAR remains inside the symmetrical triangle while traders wait for a confirmed directional move. |
Bearish | A confirmed breakdown of rising triangle support exposes $0.06706, followed by $0.06539. |
What We're Watching Next
As per the Coin Gabbar analyst, HBAR remains at a technical decision point as price tests the lower boundary of its 4-hour symmetrical triangle.
A confirmed 4-hour move above $0.07005 could improve short-term momentum and expose $0.07143 and $0.07351.
However, losing $0.06706 would increase downside risk toward $0.06539. RSI recovering above 50 alongside stronger volume would provide more convincing evidence that buyers are regaining control.
Disclaimer: This article is for informational purposes only and does not constitute financial or investment advice. Cryptocurrency markets are volatile, and readers should conduct their own research before making any trading or investment decisions.

















