SEI Price Prediction August 2026: Can It Hold $0.04 Support?


Something quiet is happening under the surface of a coin most traders wrote off months ago. Its builders just shipped two announcements back to back, the kind that usually get ignored when a chart is bleeding. Price barely blinked. So which side is right, the roadmap or the candles?
SEI Price Prediction: Network Building Fast While the Chart Says Wait
This SEI price prediction August 2026 matters because the gap between news and price has rarely been this wide. $SEI just posted a post-quantum security upgrade and closed out its "Giga Roadmap" with a new low-latency protocol, and neither moved the needle much.
That's the tension.
Builders are shipping. And the tape isn't rewarding it yet. Is that a warning or a setup? Here's the thing: this SEI price forecast has to answer both questions honestly.
Key Takeaways
SEI trades near $0.04205, per CoinMarketCap, inside a falling wedge on both daily and weekly charts that has not broken out yet.
Daily RSI sits at 33.18 and weekly RSI at 32.54, both soft but not extreme, according to TradingView chart data.
24-hour volume is $23.1M, down 13.56%, against a $308.63M market cap, a 7.59% vol/cap ratio that signals fading interest, not fresh demand.
Liquidations are minor, just $1.65K over 24 hours, meaning this move (or lack of one) isn't a leverage story.
The catalyst is technical: SIP-5, a post-quantum upgrade path, and Hermes, the final piece of Sei's Giga Roadmap, both landed this week with little price reaction.
Support sits near $0.0412, the lower Bollinger Band on both timeframes; resistance clusters at $0.0469 and $0.0516.
Table of Contents
Why $SEI Is Moving Today
$SEI Technical Analysis: Daily and Weekly
$SEI Support and Resistance Levels
$SEI Tokenomics Snapshot
Where $SEI Is Actually Trading
$SEI Price Prediction August 2026: Scenarios By Timeframe
Will $SEI Reach $1?
$SEI Market Outlook: Risks to Watch
Glossary
Methodology
Why $SEI Is Moving Today
Turns out, "moving" is generous. SEI is barely moving at all, and that's the actual story.
On July 28, Sei introduced SIP-5, a draft proposal giving every account a route to quantum-safe keys without changing addresses. A day later, Sei Labs shipped Hermes, a low-latency consensus protocol closing out the Giga Roadmap. BSCNews covered SIP-5 the same day.
None of that showed up in price. SEI is down 0.99% on the daily candle and 6.72% on the current weekly candle, per TradingView. Volume fell too. When real shipped news gets a shrug, that usually means the market's attention is elsewhere or it's waiting for something bigger, like an exchange listing catalyst or a broader altcoin rotation, before it reacts.
SEI Technical Analysis: Daily and Weekly
This SEI technical analysis is where the falling wedge actually matters, and the daily and weekly charts each tell part of the story.
Daily Chart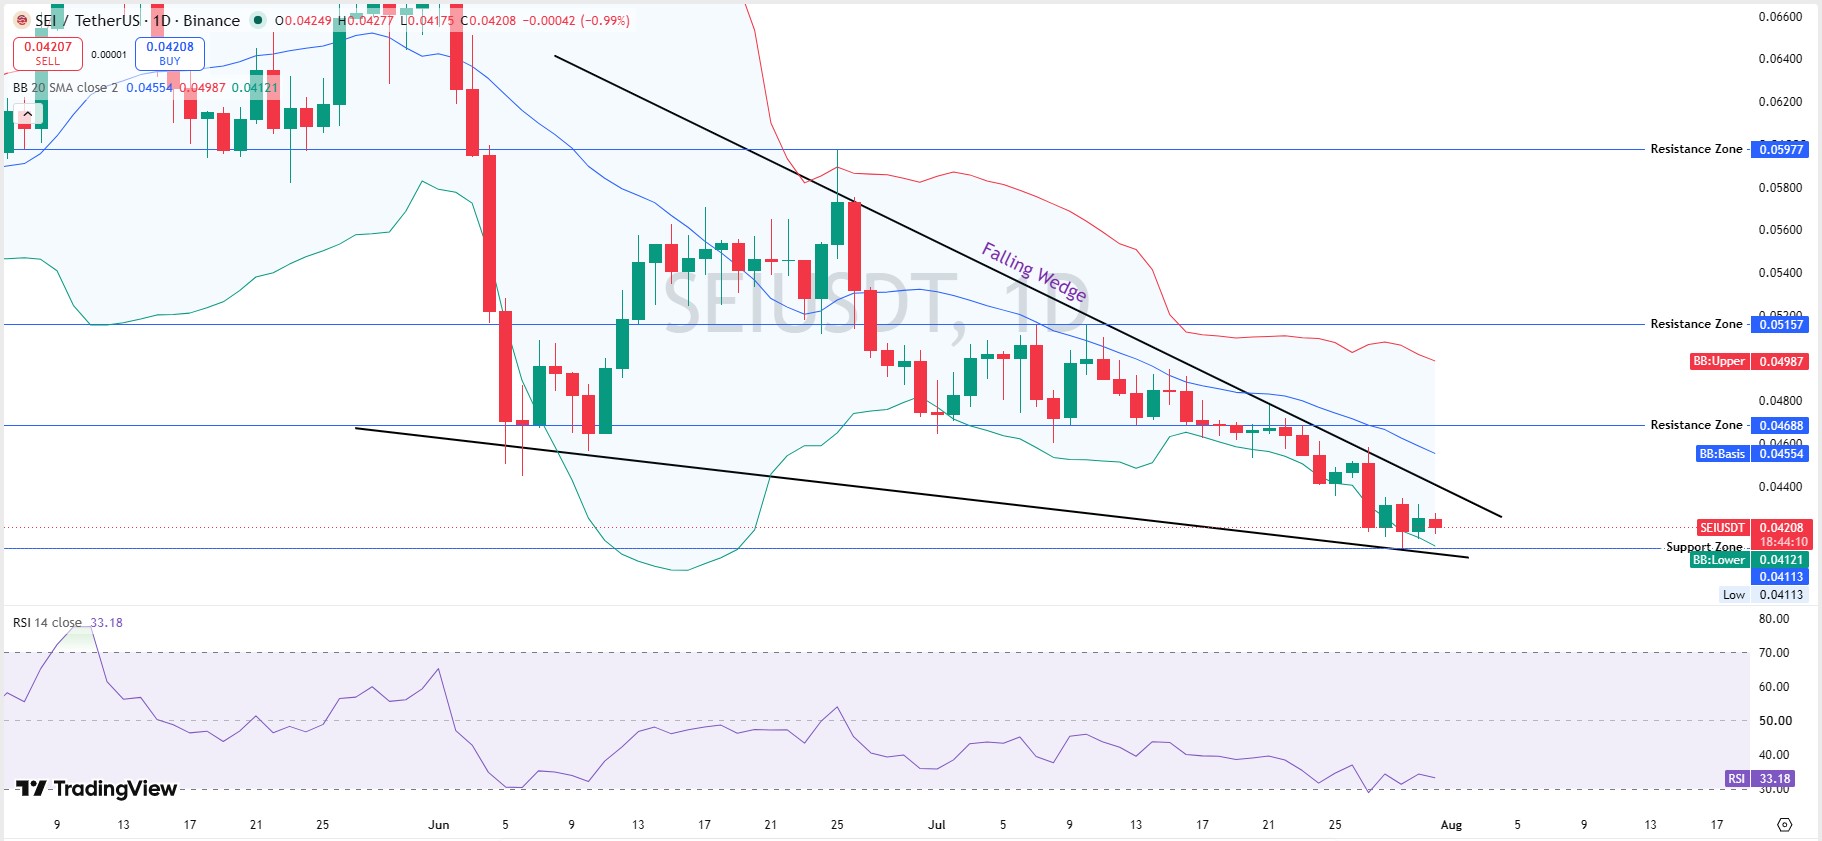
SEI has been carving a falling wedge since early June, with price now pressing against the wedge's lower boundary near $0.0412. RSI-14 reads 33.18, soft but not oversold enough to force a bounce on its own.
The daily Bollinger Bands (20 SMA, 2 close) show a basis of $0.04554, an upper band of $0.04987, and a lower band of $0.04121. The price is trading below its own basis. That's a bearish read for now.
Weekly Chart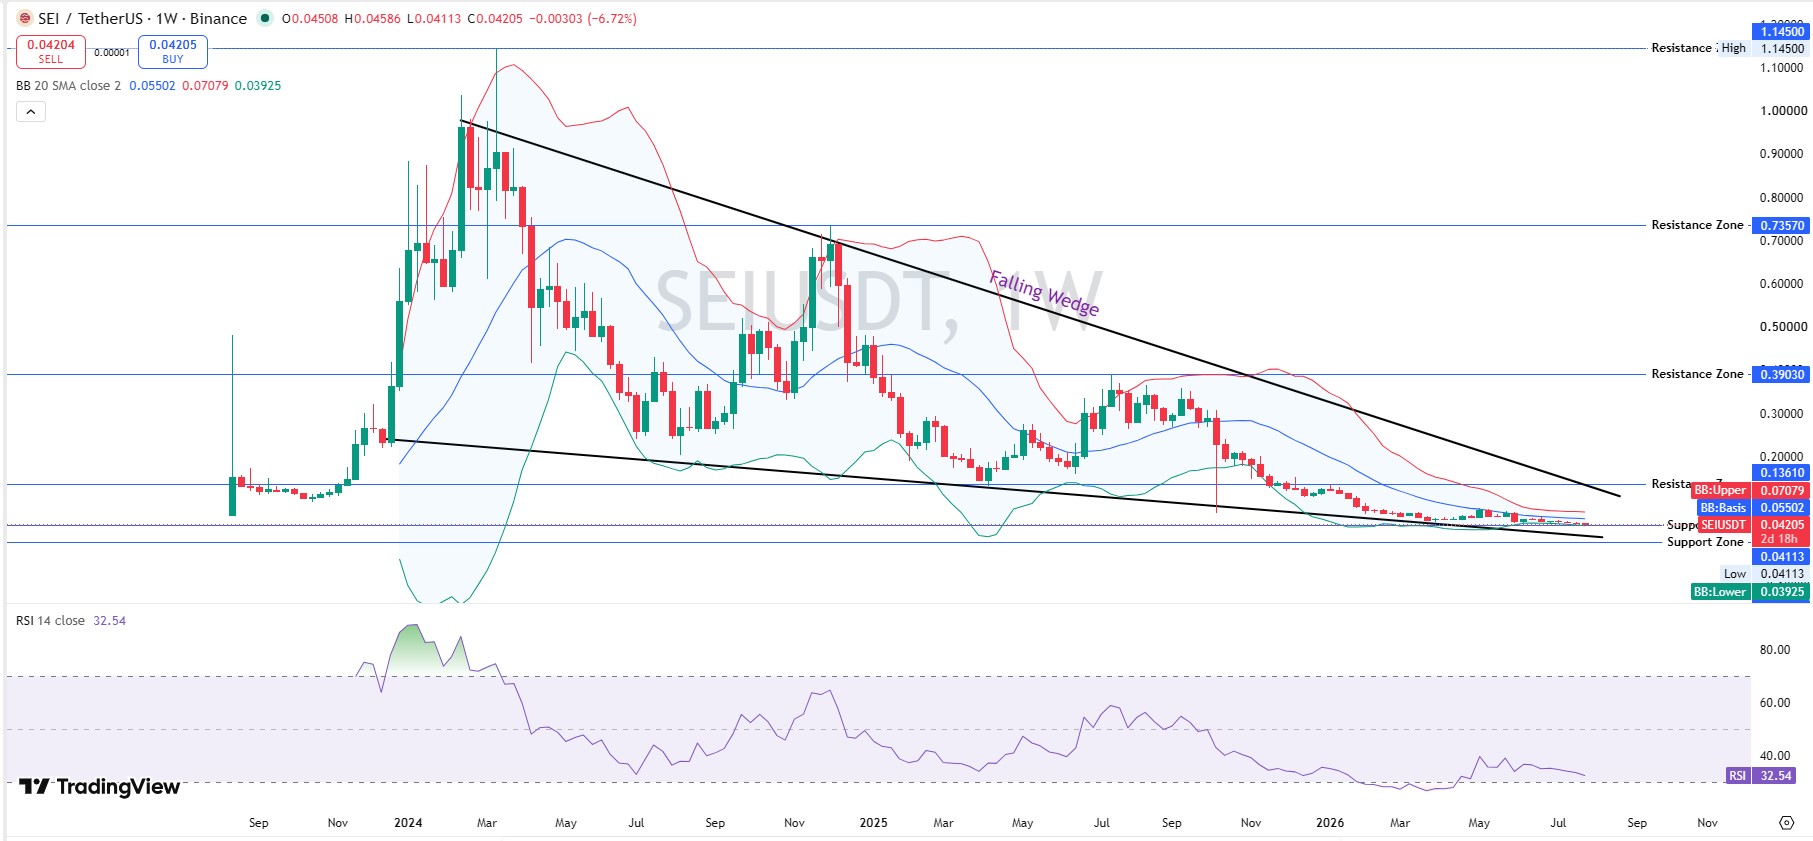
Zoom out to weekly, and the picture rhymes. A larger falling wedge has capped SEI since its 2024 all-time high near $1.145. Weekly RSI sits at 32.54.
Weekly Bollinger Bands run on a basis of $0.05502, an upper of $0.07079, and a lower of $0.03925. SEI is closer to its lower band than its middle line on both timeframes.
Neither wedge has broken. That's the part a quick scroll through the chart misses.
$SEI Support and Resistance Levels
SEI support levels start at $0.0412, the shared Bollinger lower band, and the wedge floor. Below that, the daily basis near $0.04554 flips to resistance if lost, and the weekly lower band at $0.03925 is the deeper floor.
SEI resistance levels sit at $0.0469, then $0.0516, then $0.0598 on the daily structure. On a weekly basis, $0.1361 and $0.3903 are the levels a real trend reversal would eventually need, though those are a long way off.
A daily close under $0.0412 opens the door toward the weekly low band. A close back above $0.0455 would be the first sign buyers are stepping back in.
$SEI Tokenomics Snapshot
SEI's circulating supply is 7.33B tokens against a max and total supply of 10B, per CoinMarketCap. Market cap sits at $308.63M, with a fully diluted valuation of $420.54M once the remaining supply unlocks. The project carries a CertiK rating of 4.5 out of 5.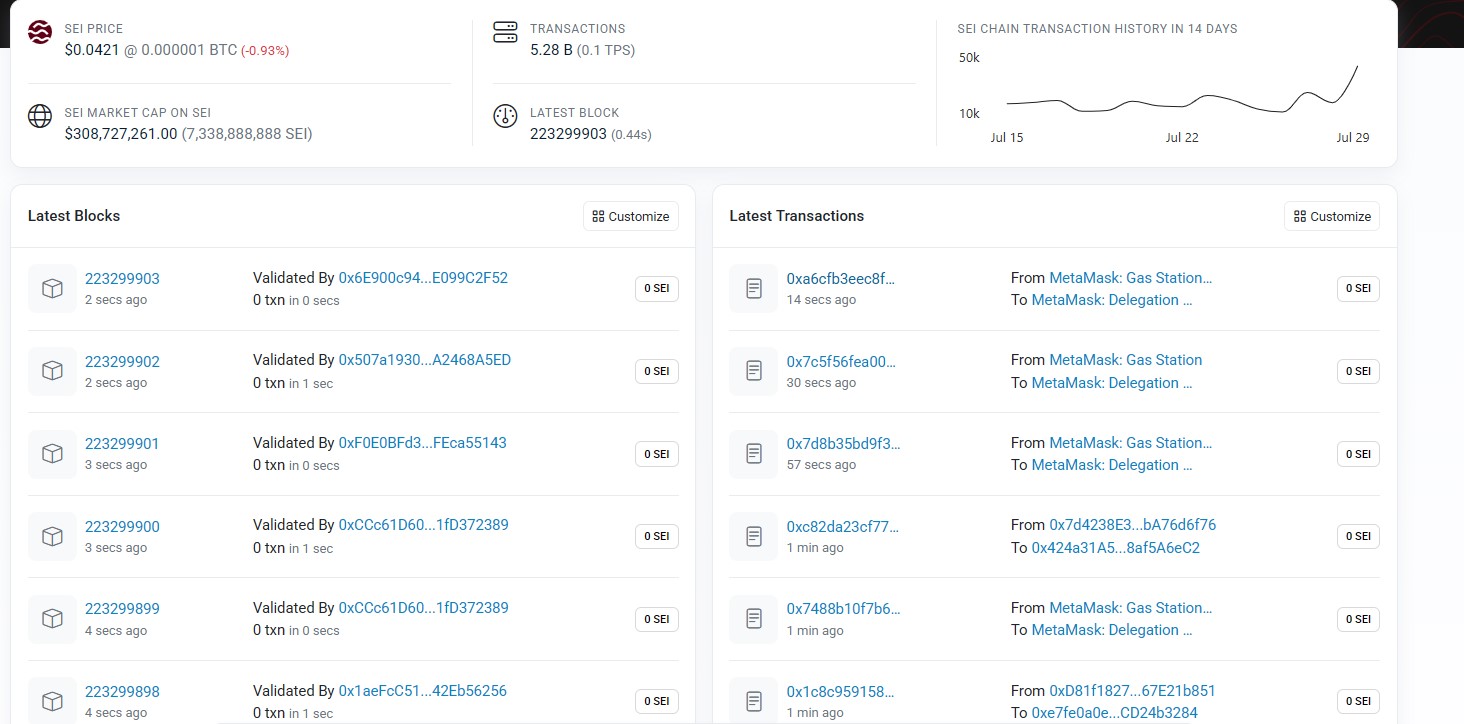
We didn't find detailed whale-wallet or Gini concentration data on CoinMarketCap or CoinGlass for SEI, so we're not guessing at numbers here. What we can say: with 27% of supply still to enter circulation, unlock-driven dilution is a real, ongoing pressure on price, separate from any short-term chart pattern.
Where $SEI Is Actually Trading
Futures volume is split across venues, per CoinGlass: LBank leads at $12.92M; Binance follows at $6.88M; then Bybit at $3.65M, BingX at $2.47M, and smaller slices on MEXC, WhiteBIT, OKX, Bitget, and KuCoin. Combined futures volume runs below SEI's own market cap, unlike setups where leverage dwarfs the underlying coin. That's a quieter, less fragile structure.
$SEI Price Prediction August 2026: Scenarios By Timeframe
Timeframe | Bull Case | Base Case | Bear Case |
24H | Reclaims $0.0455, tests $0.0469 (probability: low) | Chops $0.0412-$0.0455 (probability: high) | Breaks $0.0412, slips toward $0.0393 (probability: moderate) |
7D | Weekly close above $0.0455 shifts structure neutral-bullish (probability: low) | Range-bound $0.039-$0.047 while wedge holds (probability: high) | Weekly close under $0.0393 opens $0.035 zone (probability: moderate) |
2026 | Giga Roadmap adoption plus a wider alt rally lifts SEI toward $0.13-$0.39 (probability: low) | Drifts $0.035-$0.06 tracking sector mood (probability: moderate) | Unlock pressure and thin volume drag SEI toward its $0.0080 all-time low zone (probability: low-moderate) |
Invalidation for the bullish case is a daily close under $0.0412. These are directional reads tied to current chart structure, not guarantees.
Will $SEI Reach $1?
Not soon. $SEI hit an all-time high of $1.145 back in March 2024 and now sits 96.33% below it. Getting back to $1 needs roughly a 24x move from here, something this wedge structure gives no evidence of right now. A more realistic 2026 ceiling sits near the $0.13-$0.39 resistance band flagged above, and even that needs a real trend shift first.
SEI Market Outlook: Risks to Watch
Supply dilution tops the list. With FDV at $420.54M against a $308.63M market cap, roughly 27% of supply still hasn't hit the market.
And fading volume matters just as much. A 13.56% drop in 24-hour turnover during a week with real shipped news is a soft signal, not a loud one.
Glossary
RSI (Relative Strength Index): A 0-100 momentum gauge; readings near 30 flag oversold pressure, and above 70 flags overbought.
Bollinger Bands: Volatility bands around a moving average; price near the lower band signals a stretched downside move.
Falling Wedge: A chart pattern where price compresses downward between converging lines, often resolving upward once broken.
FDV (Fully Diluted Valuation): What market cap would be if every token, including locked supply, were circulating.
Methodology
Chart levels came from SEI/USDT daily and weekly charts on TradingView (Binance data), using RSI-14 and 20-period Bollinger Bands, and captured July 31, 2026. Supply, market cap, and FDV figures came from CoinMarketCap. Futures volume and liquidation data came from CoinGlass. On-chain transaction data referenced Seiscan. Contract: ibc/71F11BC0AF8E526B80E44172EBA9D3F0A8E03950BB882325435691EBC9450B1D.
Disclaimer: This is speculative market commentary, not financial or investment advice. Crypto assets are volatile and can lose most or all of their value. Data is current as of July 31, 2026, 06:33 UTC; verify live figures before trading.











.jpg)






