Shiba Inu Price Prediction: Don't Miss SHIB's Next Big Move


For weeks, SHIB did what SHIB has done for most of this cycle: grind lower. Lower highs, lower lows, the kind of slow bleed that makes traders stop checking the app altogether.
Then, seemingly out of nowhere, the setup flipped, and the chart suddenly looked worth paying attention to again.
Here's a Shiba Inu price prediction july 2026: a full breakdown of what's driving the move, what the charts are showing on both the daily and 4-hour timeframes, where the volume is really coming from, and what the liquidation data reveals about who was actually caught offside.
The News Behind the Move
Price action rarely moves in a vacuum, and this rally has an actual catalyst behind it rather than just speculative momentum.
The key development is coming out of Japan. 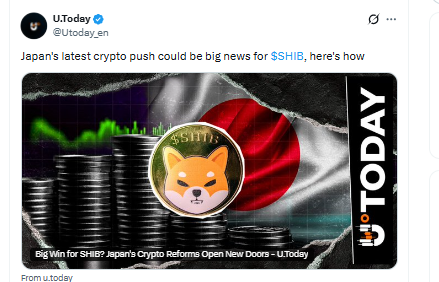
Source: Data Taken From X
Analysts tracking the Shiba Inu community have been highlighting how Japanese regulators are steadily positioning the country as one of the more crypto-friendly jurisdictions globally.
There is discussion around formally regulating digital assets as financial products and even opening the door to crypto ETFs.
The detail that matters most for SHIB holders: the token already sits on Japan's JVCEA Green List, the same approved tier that includes Bitcoin and Ethereum.
Coming from one of the world's stricter regulatory bodies, that's a meaningful signal of legitimacy, not just a talking point.
Combine that with visible whale wallet activity, a pickup in token burns, and the story gaining traction across social media, and you get the kind of sentiment shift that tends to precede real technical moves.
News typically sets the stage; the charts confirm it.
What the Liquidation Data Reveals
This is the piece of the puzzle that's easy to overlook, but it may explain the move better than anything else.
Liquidation data pulled from Coinglass tells a consistent story across every timeframe: 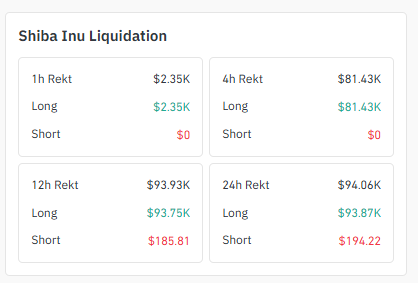
Source: Liquidation Data Taken From Coinglass.
1 hour: roughly $2,350 liquidated, almost entirely long positions
4 hours: about $81,430 liquidated, again dominated by longs
12 hours: nearly $93,930 liquidated, $93,750 of it longs, with shorts accounting for barely $186
24 hours: around $94,060 total, split roughly $93,870 in long positions versus just $194 in short positions
In other words, during what looked like a breakdown, it wasn't short sellers getting squeezed; it was over-leveraged long positions getting wiped out repeatedly. Shorts were essentially untouched.
That pattern isn't random. It looks like classic market behavior: leveraged, weak-handed buyers get flushed out first, and only after that cleanup does the real trend emerge.
Traders who've been through a few cycles will recognize the sequence: liquidation flush, then genuine trend continuation.
Checking Whether the Volume Is Real
Before trusting any breakout, it's worth verifying whether the volume behind it is broad-based or concentrated on a single, thinly traded exchange.
In SHIB's case, the volume looks distributed rather than isolated. LBank currently leads spot trading activity at roughly $14.3 million. 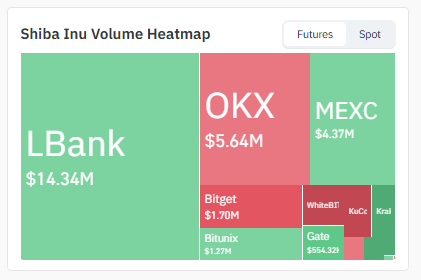
Source: Heatmap Data Taken From Coinglass.
While on the derivatives side OKX (about $5.6 million) and MEXC (around $4.4 million) are carrying the bulk of futures volume. Smaller but steady activity is also showing up on Bitget, WhiteBIT, KuCoin, Krai, and Gate.
That spread is a good sign. A rally concentrated on one obscure exchange is usually a red flag for manipulation.
Volume spread across several major platforms generally points to genuine participation rather than a single wallet moving a thin order book.
The 4-Hour Chart: A Closer Look
Zooming into the 4-hour timeframe shows the same story in more detail. Price has now bounced twice off the 0.00000414–0.00000418 zone, which is starting to look like a legitimate support base rather than a coincidence.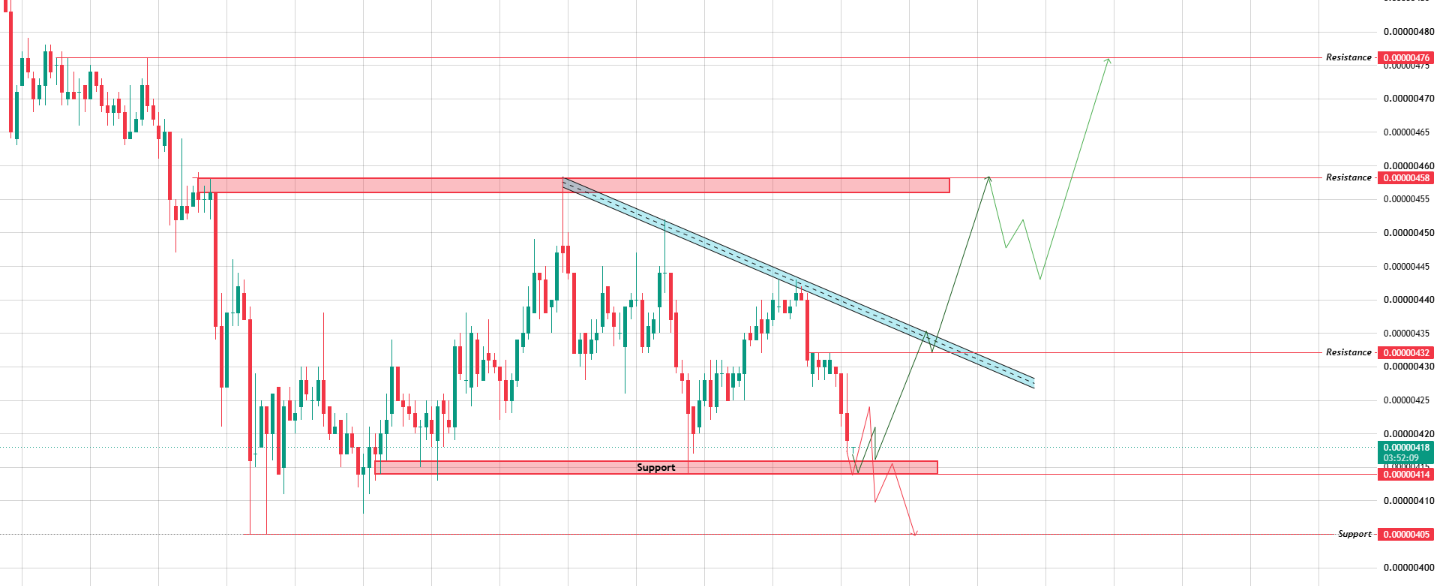
Source: Chart Taken From TradingView
| Level | Price (USD) | Significance |
|---|---|---|
| Resistance 2 | 0.00000458 | Sits just above the prior downtrend line and acts as the next upside target. |
| Resistance 1 | 0.00000432 | The first short-term hurdle buyers need to overcome. |
| Support 1 | 0.00000414 – 0.00000418 | A key demand zone that has held firm on two separate tests. |
| Support 2 (Breakdown Level) | 0.00000405 | A break below this level would weaken the short-term bullish outlook. |
As long as that support zone continues to hold, the next logical step would be a move through 0.00000432 and toward 0.00000458, with 0.00000476 in play if buyers stay firmly in control.
It's worth understanding how this plays out in either direction.
If price pushes up and breaks cleanly through the short-term trendline resistance around 0.00000432, that's typically read as a bullish confirmation.
It opens the door for a bounce toward 0.00000458 and from there toward the 0.00000476 stretch target, since each broken resistance level tends to flip into support on the way up.
On the flip side, if the 0.00000414–0.00000418 support zone fails to hold and price closes below it, the setup doesn't just weaken; it usually slides toward the next support shelf at 0.00000405.
A break of that second support would be a more serious warning sign, suggesting buyers have lost control of the short-term structure and the bullish case on the 4-hour chart needs to be reassessed.
The Daily Chart: A Fakeout, Then the Real Breakout
This is the chart most people are actually asking about.
For weeks, SHIB was trapped inside a textbook descending channel: every rally sold into and every support level eventually broken. 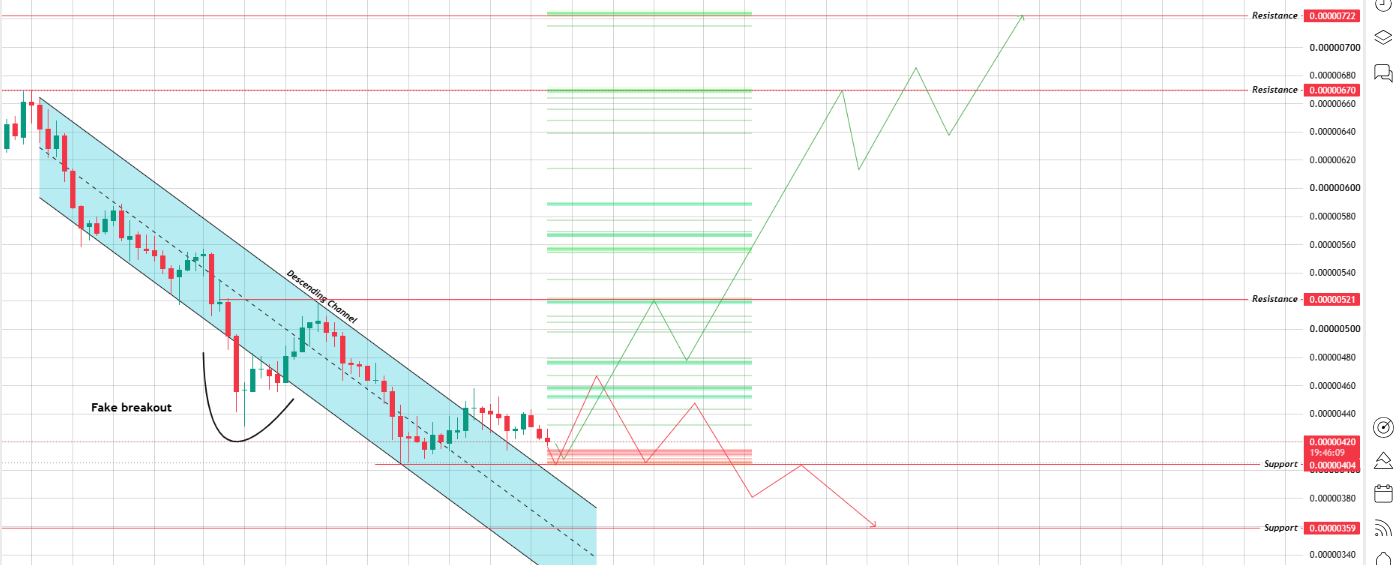
Source: Chart Taken From TradingView
Then the price dipped below the channel's lower boundary, and for a moment it genuinely looked like the bottom was giving way. Shorts piled in expecting further downside.
Instead, price snapped back within hours and pushed straight through the channel's upper trendline, a clean shakeout disguised as a breakdown, followed by a real reversal.
It's the kind of move that separates panic-driven traders from whoever was quietly accumulating during the dip.
Current daily levels to watch:
| Level | Price (USD) | Significance |
|---|---|---|
| Resistance 2 | 0.00000670 | The next major upside hurdle after clearing the first resistance. |
| Resistance 1 | 0.00000521 | The first key resistance buyers need to overcome. |
| Support 1 | 0.00000404 – 0.00000420 | A strong demand zone where buyers have consistently stepped in. |
| Deep Support (Invalidation) | 0.00000359 | A daily break below this level would undermine the current bullish thesis. |
A clean daily close above 0.00000521 would open the path toward 0.00000670, with 0.00000722 becoming a realistic target if momentum continues building over the coming weeks.
Putting It All Together
Taken together, the regulatory tailwind out of Japan and volume spread across multiple credible exchanges.
A fake breakdown that turned into a genuine channel breakout and a long liquidation flush that cleared out weak hands, the near-to-medium-term picture for SHIB is leaning bullish.
Above the 0.00000404–0.00000420 support zone, 0.00000521 is the level to watch first, with 0.00000670 and 0.00000722 as the next logical targets if the move continues.
The level that would invalidate this entire setup is a daily close below 0.00000359.
Until that happens, the breakout arguably deserves the benefit of the doubt, but that invalidation level is worth watching closely regardless of how confident the setup looks.
Disclaimer: This is a technical and market overview, not financial advice. Crypto markets are volatile, and price levels can shift quickly. Always do your own research before trading.

















