Shiba Inu Price Prediction July 2026: Don't Miss SHIB Next Move

Something's about to give. SHIB has been squeezed into a tighter and tighter box for weeks, and price boxes like this one don't sit quiet forever.
This shiba inu price prediction July 2026 isn't about picking a side out of hope; it's about reading exactly where the lines cross and exactly what happens the moment they do.
Current $SHIB Price and Where It Stands Right Now
SHIB is trading around $0.00000422 at the time of writing.
Not a level anyone's celebrating, sure, but it's sitting right at the sharp end of a pattern that's been building for a while.
Every session that passes without a move just tightens the coil further.
Social Sentiment Check: $SHIB Whales Aren't Blinking
Here's the part that should make bears pause. While price has been sliding into the triangle apex, on-chain data is flashing the opposite signal entirely.
A widely shared report from @thecryptobasic, citing CryptoQuant, pointed to roughly 174.8 billion SHIB pulled off exchanges in a single 24-hour stretch, close to $792,000 at current prices.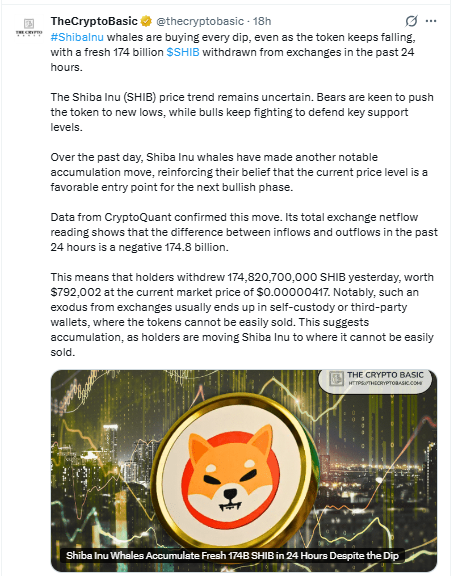
Source: Data Taken From X
That kind of exchange net flow swing doesn't happen by accident. Coins leaving exchanges tend to land in self-custody wallets, where they're parked, not primed to sell.
Read it as whale accumulation, and the bull case for a triangle breakout gets a lot more credible.
Read it skeptically, and sure, accumulation can front-run a bounce that's still weeks away.
Either way, someone big is buying this dip, quietly, while everyone else watches the chart bleed.
$SHIB Liquidation Data: Longs Are Feeling the Squeeze
Leverage traders are already paying for guessing wrong on the liquidation heatmap.
In the last hour alone, $85.17 got liquidated; all of it longs, and zero shorts touched. Stretch that out to four hours and liquidate. 41 total longs were long against a $35.24 short. 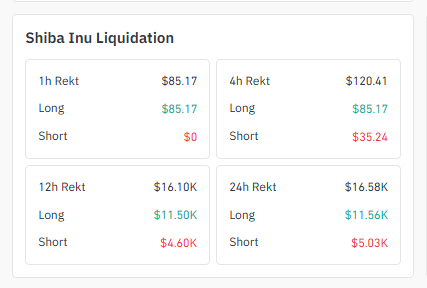
Source: Liquidation Data Taken From Coinglass
Not a huge number in dollar terms, but the lopsidedness says everything.
Widen the lens and the patterns. Twelve-hour liquidations sit at $16.10K, $11.50K of that long-side against $16.10K, with 60K short.
Twenty-four hours brings the total to $16.58K, splitting the $11.56K long to $5.03K short.
Every bounce inside this triangle has been a trap for leveraged longs, which tracks, given that splitting the arc has been grinding lower into the apex the whole time.
Exchange Volume Heatmap: Where the Futures Action Is
LBank is running the show on the $SHIB exchange volume right now, clocking $15.97M in futures activity, nearly double the next closest venue. 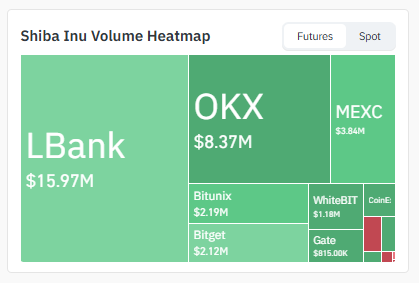
Source: Heatmap Data Taken From Coinglass
OKX follows at $8.37M, then MEXC at $3.84M. Bitunix ($2.19M), Bitget ($2.12M), WhiteBIT ($1.18M), and Gate ($815K) fill out the rest, with a few smaller venues showing minor activity too.
When volume concentrates this heavily on one or two exchanges, it usually means derivatives desks, not casual spot buyers, are the ones actively defending or attacking these triangle levels.
4H Chart: Descending Channel Setting Up the Next Move
Shiba Inu is currently trading at $0.00000422, and on the 4-hour chart that price is sitting right inside a textbook descending channel upper and lower boundaries both sloping down in parallel, squeezing price tighter with every candle. 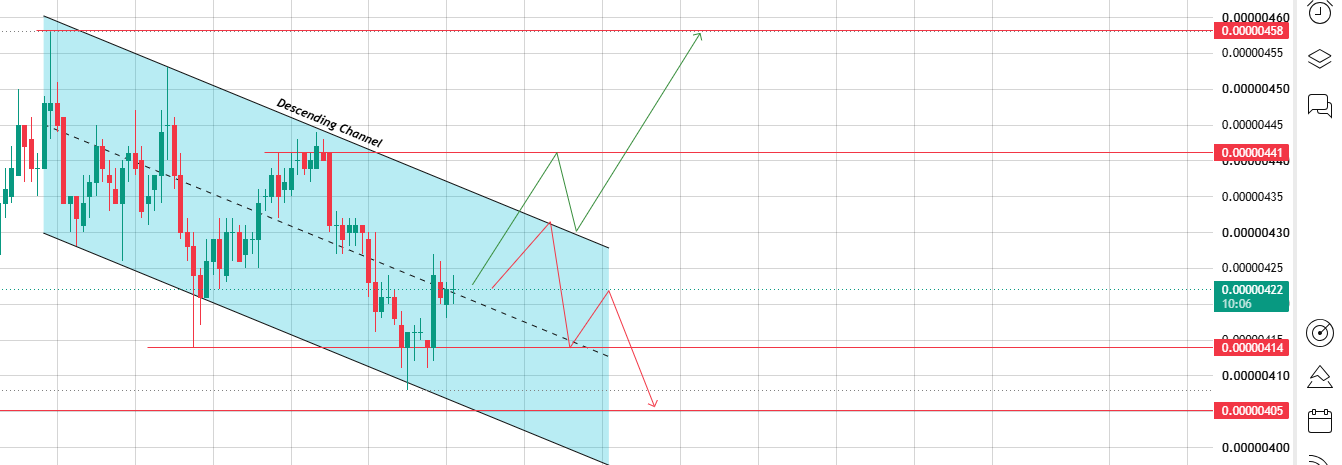
Source: Chart Taken From TradingView.
Break below the channel floor, and the support zone at $0.00000414 comes into play immediately, with $0.00000405 as the next magnet down.
But and this matters: a break above the channel's upper boundary flips the story completely, with $0.00000441 as the first target and $0.00000458 above that if momentum holds.
Two patterns, two timeframes, same message: SHIB is coiled, and coiled charts move fast once they decide.
1D Chart: SHIB's Descending Triangle Nears Its Apex
Zooming out to the daily chart, the setup is recognizable as a clean descending triangle, with an upper trendline sloping down and a lower trendline sloping up, both converging toward the same apex. 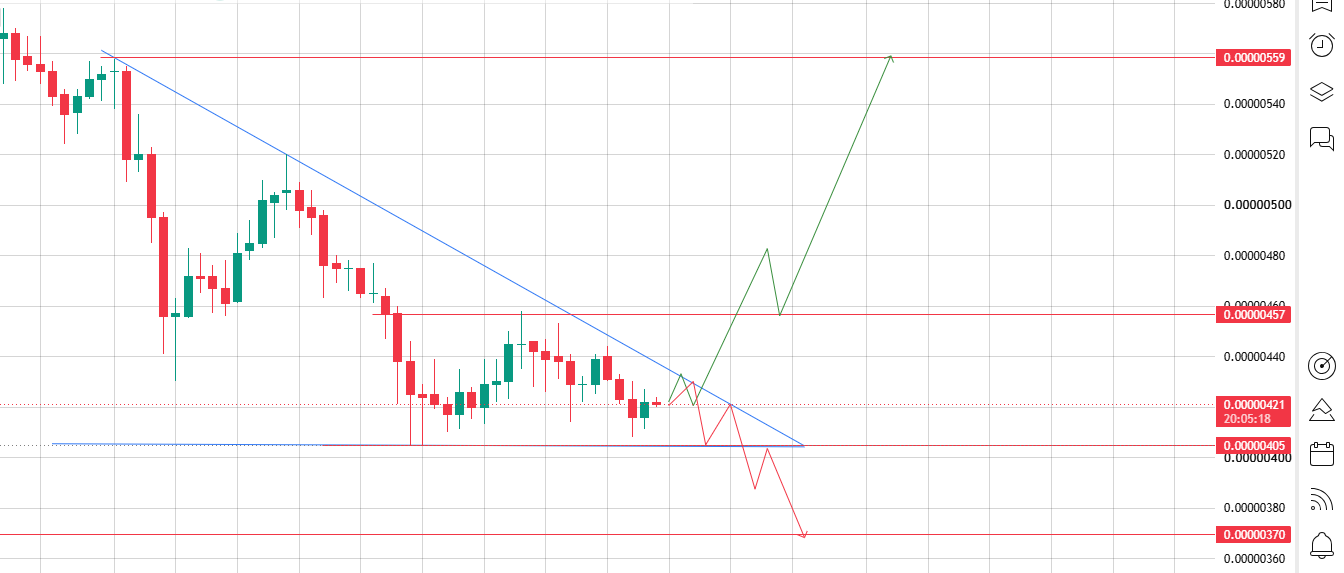
Source: Chart Taken From TradingView.
This isn't a random shape traders are imagining in candles.
It's a genuine compression pattern, and $SHIB is sitting almost dead center of it right now, near $0.00000421.
Two doors here, and only two. Break the upper trendline with real volume, and $0.00000457 becomes the first stop, with a stretch target of $0.00000559 if buyers keep the pressure on; that would mark a serious character change for this chart.
Break the lower trendline instead, and $0.00000405 gets tested first, with a slide toward $0.00000370 on the table if sellers take control.
A descending triangle this tight almost always resolves with a sharp move, not a slow drift. Apex breaks tend to run.
SHIB Three-Scenario Price Outlook: Bull, Bear, Neutral
| Scenario | Trigger | Price Target |
|---|---|---|
| Bullish Breakout | Triangle and channel both break upward through $0.00000441–$0.00000457. | $0.00000559 |
| Neutral / Range-bound | Price stays trapped inside the triangle and channel overlap. | $0.00000405–$0.00000441 |
| Bearish Breakdown | Triangle and channel both break downward through $0.00000414–$0.00000405. | $0.00000370 |
Final Outlook: What Could Tip SHIB's Next Big Move
Two patterns, one story: SHIB is compressed and running out of room to hide.
The daily descending triangle and the 4-hour descending channel are both closing in on their decision points at almost the same time, which raises the odds of a genuinely sharp move rather than another slow grind.
Add in leveraged longs getting flushed on repeat and whales quietly stacking off-exchange, and this stops looking like a coin drifting toward zero; it starts looking like a coin loading a spring.
Macro will likely be the tiebreaker. SHIB tends to lean hard on BTC dominance when Bitcoin chops sideways and risk appetite creeps back into altcoins; meme names like SHIB are usually first in line for a disproportionate bounce.
There's an ETH correlation angle too, given SHIB's ERC-20 roots; Ethereum strength has historically pulled SHIB along with it.
Stable-to-bullish action from BTC and ETH in the coming sessions could be exactly what pushes SHIB toward a bullish breakout through the upper boundary of both patterns instead of a bearish breakdown through the lower one.
Until that resolves, every candle inside $0.00000405–$0.00000441 is just SHIB winding the spring a little tighter.
Disclaimer: This article is for informational purposes only and should not be taken as financial advice. Always do your own research before making investment decisions.