Solana Price Prediction: Can SOL Defend Its Key $73 Support Zone?


Solana is trading near $73.89 today, down a small 0.11% over the past 24 hours. The token is stuck in a tight range, and traders are watching closely to see which way it breaks.
Data shows Solana's market cap sits at $42.90 billion, with a circulating supply of 581.30 million SOL out of a total supply of 631.62 million.
Spot volume over the last day came in at $299.35 million, while futures volume was much higher at $5.66 billion.
That gap between spot and futures activity is one of the reasons traders are talking about Solana right now.
Is Solana in a distribution phase right now?
Crypto analyst Ted Pillows pointed out something interesting this week. He said SOL is going sideways, but spot markets are selling.
According to him, this pattern looks like distribution. Distribution usually happens when bigger holders slowly sell their coins into a sideways market, often before a bigger move down.
His chart showed SOL bouncing inside a boxed range near $73 to $76, while spot sell volume kept climbing on aggregated CVD data. That is a warning sign traders do not like to ignore.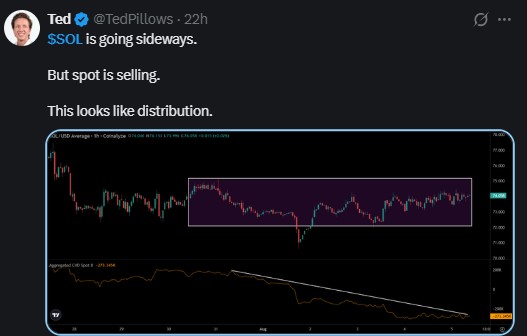
What do the Solana charts show today?
Looking at the daily chart, $SOL is trading inside a falling channel. This channel sits within a bigger, older ascending channel that goes back to March.
Price got rejected near the top of that larger ascending channel back in July, close to $95. Since then, SOL has been pulling back and now trades around the $73 to $74 zone.
The 20-day EMA is at $74.52, the 50-day EMA is at $75.50, the 100-day EMA is at $78.76, and the 200-day EMA is much higher at $90.86. Most short-term averages sit right above the current price, which is a sign of ongoing weakness.
The RSI on the daily chart reads 46.34, with its moving average at 44.95. Both levels sit below the neutral 50 mark, meaning momentum is leaning slightly bearish but not oversold yet.
Key Solana price levels to watch
Level Type | Price Zone | What It Means |
Immediate Support | $73.00 - $74.00 | Buyers defending the lower channel line |
Resistance | $75.50 - $76.00 | Falling channel top, near 50 EMA |
Upside Target 1 | $78.80 | Near 100 EMA |
Upside Target 2 | $82.00 | Mid-range resistance |
Upside Target 3 | $88.00 - $90.00 | Upper ascending channel boundary |
Downside Target 1 | $70.00 | First support if $73 breaks |
Downside Target 2 | $67.00 | Lower channel support |
What could push Solana price higher?
A daily close above $75.50 to $76.00 would be a good sign for bulls. That level lines up closely with the 50-day EMA, so a clean break above it often draws in more buyers.
If that happens, SOL could then aim for $78.80 first. After that, $82.00 becomes the next stop, followed by the $88 to $90 zone near the top of the larger ascending channel.
This kind of move would suggest the recent dip was just a correction, not the start of a bigger downtrend.
What could send Solana price lower?
The flip side is just as important. If SOL loses the $73 support with a strong daily close below the channel, sellers could take control fast.
That kind of breakdown could open the door to $70 first, and then $67 after that. Given what Ted Pillows flagged about spot selling and possible distribution, a break below $73 would add weight to the bearish case.
Derivatives data shows a cautious market
Open interest across Solana futures currently sits at $4.47 billion, down 0.48% over the past day. Options volume dropped sharply too, down 17.46% to $5.33 million, though options open interest rose 3.21% to $76.04 million.
The long/short ratio across the market is 0.9806, showing a fairly even split between bulls and bears right now.
On Binance, the SOL/USDT long/short account ratio is 2.4771, and on OKX it is 2.75. Top traders on Binance show a long/short account ratio of 2.9324, but their positions ratio is lower at 1.8434.
This gap between account ratio and position ratio suggests that while more accounts are long, the actual size of short positions carries more weight.
Liquidation data also tells a story. Over the past 24 hours, $2.87 million in Solana positions got wiped out, with $1.36 million from longs and $1.51 million from shorts.
In just the last 4 hours, $187.05K was liquidated, with shorts taking the bigger hit at $106.67K.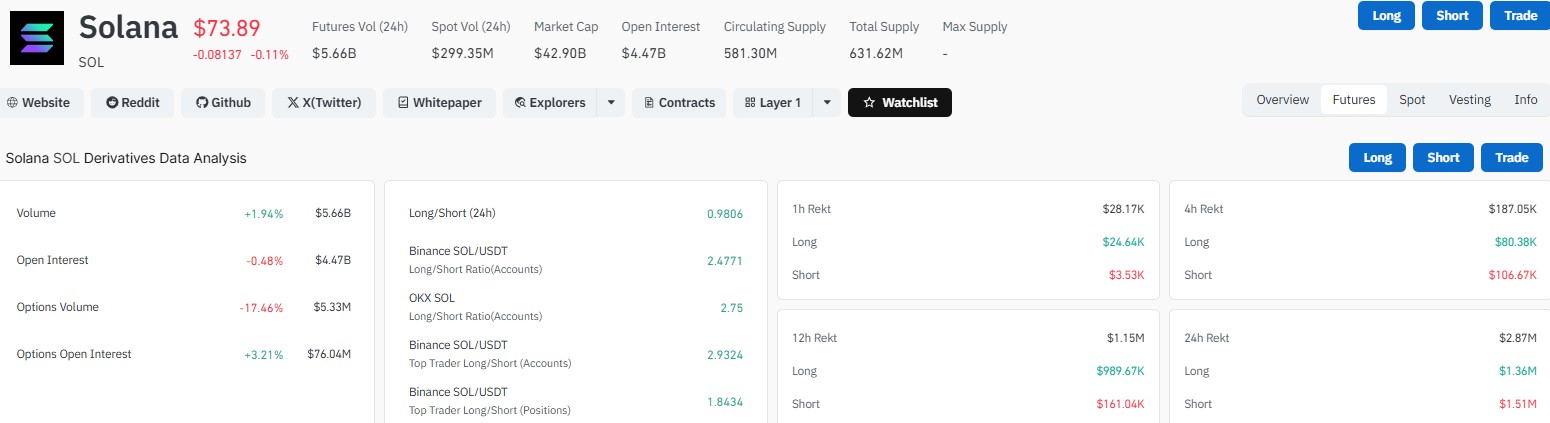
Solana price prediction: what happens next?
Solana sits at a decision point. The $73 to $74 zone is the line in the sand for now.
A close above $75.50 could open a path back toward $78 and $82. A close below $73 could send SOL down toward $70 and $67.
Given the mixed derivatives data and the spot selling flagged in recent chart analysis, traders may want to wait for a clear daily close before taking a strong position either way.
Disclaimer
This article is for informational purposes only and does not constitute financial, investment, or trading advice. Cryptocurrency markets are highly volatile and carry significant risk. Always do your own research and consult a licensed financial advisor before making any investment decisions.


















