SPX6900 Price Prediction 2026-2050: The 75X Breakout Everyone Watching

$SPX6900 just posted a monster monthly candle, and this SPX6900 price prediction 2026-2050 breakdown exists to separate the real chart structure from the hype that always follows a move like this.
The token opened at $0.33826590, dipped to $0.32946337, and pushed all the way to $0.43229562 before closing the month at $0.39076867, a 15.52% gain that's got the whole community watching the next candle closely.
SPX6900 Current Price Level
SPX6900 is trading right at $0.39076867 as of this writing, sitting comfortably above a support shelf at $0.32928889 and a deeper Fibonacci base near $0.25364980.
Any honest $SPX6900 price prediction 2026-2050 has to start from this exact spot, since it's the level every resistance target above gets measured against.
Current price also sits inside a well-defined ascending channel that's been forming over the past several months, with a rising trendline underneath acting as dynamic support and a parallel line above capping every prior push higher.
A confirmed breakout above that channel ceiling is one of the more bullish technical signals a chart like this can produce.
Monthly Chart and Fibonacci Structure
The Fibonacci retracement anchored to $SPX6900's swing low at $0.25364515 lays out a clean, level-by-level roadmap, and this table is the backbone of the entire SPX6900 price prediction 2026-2050 that follows: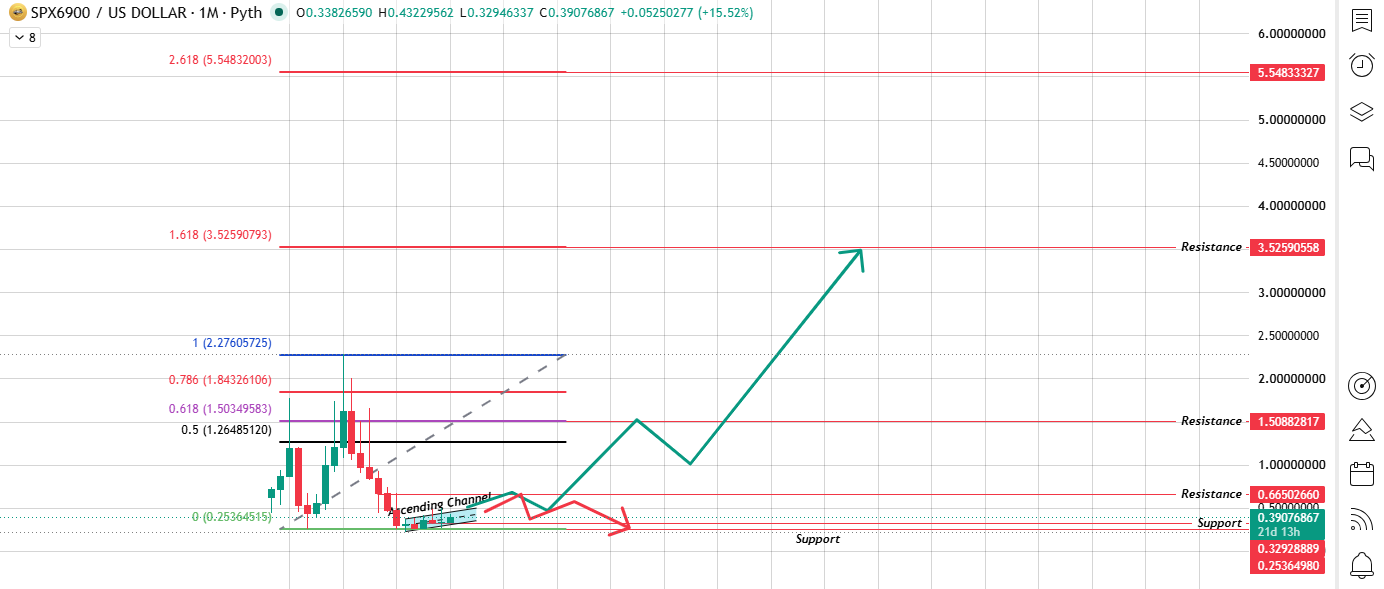
Source: Chart Taken From TradingView
None of this is guesswork stacked on guesswork; these are the exact levels the chart's own Fibonacci tool is marking.
SPX6900 Price Prediction 2026-2030
In the short term, this $SPX6900 price prediction for 2026-2050 stays tied to whether the ascending channel breakout holds through the rest of 2026.
A confirmed close above Resistance 1 at $0.66502660 would be the clearest signal yet that the channel has resolved to the upside, opening a path toward the 0.5 Fib level at $1.26485120 before the year is out.
By 2027, if that momentum carries forward, Resistance 1 gets fully cleared and price pushes into the 0.618 Fib zone at $1.50882817.
The golden ratio confirmation level chartists watch for a genuine trend change rather than a temporary spike.
2028 is where the move accelerates in this scenario, with SPX6900 working through the 0.786 Fib at $1.84326106 and the full 1.0 Fib retracement near $2.27605725.
A complete round-trip back to the token's prior swing high, achieved well ahead of the original 2030 target window.
By 2029, Resistance 2 and the 1.618 extension near $3.52590558 come into range, and 2030 is where the whole Fibonacci ladder finally gets tested in full.
A push into and through the 2.618 extension near $5.54833327 would put SPX6900 in the $5 territory by 2030 under this accelerated bullish path.
Getting there this fast depends on sustained community momentum and continuous rotation of capital into meme-driven assets; a compressed timeline like this is the aggressive case, not the guaranteed one.
SPX6900 Price Prediction 2035-2040
Stretching further out, this SPX6900 price prediction 2026-2050 shifts from short-term chart momentum.
Whether $SPX6900 can hold cultural relevance across multiple market cycles, the same test every long-lived meme coin eventually faces.
With the entire charted Fibonacci ladder already in play by 2030 under the bullish path, the 2030s become less about individual retracement levels and more about whether SPX6900 can keep compounding on top of that base.
It wouldn't happen in a straight line; expect sharp pullbacks along the way, echoing the same volatility that's defined $SPX6900's price history since launch.
By 2040, assuming the token maintains a loyal, active community and keeps picking up fresh listings and liquidity.
Builds on the momentum established earlier in the forecast, a price near $15 enters the range worth discussing for that decade, roughly 2.7x above the 2030 bull-case level.
That number sits beyond the chart's own Fibonacci extensions, so treat it as an extrapolated, higher-confidence-required scenario rather than a level the chart itself is marking.
SPX6900 Price Prediction 2050
A 2050 number has to be treated as a long-range thought exercise rather than a forecast 24 years is simply too far out for any chart-based model to project with real precision, and this SPX6900 price prediction 2026-2050 makes no claim otherwise.
Bearish scenario: $SPX6900 loses relevance as community attention rotates to newer tokens, the ascending channel breaks down, and price settles back into the $0.15 to $0.40 range, similar to where many aging meme coins eventually land.
Base scenario: $SPX6900 keeps a loyal community and steady liquidity, oscillating well above its charted Fibonacci ladder and landing somewhere between $15 and $20 by 2050, a continuation of the 2040 trajectory rather than a fresh acceleration.
Bullish scenario: $SPX6900 becomes one of the rare tokens that survives and compounds relevance across decades, pushing toward $30 by 2050, roughly double the 2040 bull-case target, and the outer edge of what this forecast considers possible, contingent on demand staying strong far longer than it has to date.
SPX6900 Price Prediction Target Table (2026-2050)
This table is the fastest way to scan every stage of this spx6900 price prediction 2026-2050, at once.
Treat the upper end of each range as an optimistic, low-probability scenario rather than a base-rate expectation.
These figures are illustrative, anchored partly to the chart's own Fibonacci ladder and partly to extrapolated long-range multiples, not guaranteed outcomes.
Factors That Could Shape SPX6900 Through 2050
A handful of variables will decide whether this SPX6900 price prediction 2026-2050 leans toward its bearish or bullish end over the coming decades.
Channel confirmation matters first; whether the current ascending channel breakout holds on a monthly close basis sets the tone for the rest of this decade.
Community strength is the second major driver, since meme coins live and die by how engaged and loyal their holder base stays over time.
Broader crypto market cycles play a role too. Bitcoin and Ethereum bull and bear phases tend to drag meme-driven assets like SPX6900 along with them.
Exchange listings and liquidity would help stabilize valuations at whatever level this token eventually settles into, and cultural relevance $SPX6900's satirical branding against traditional finance benchmarks needs to keep resonating with new waves of crypto users to stay meaningful decades out.
Final Thoughts
$SPX6900's chart just delivered exactly the kind of monthly candle that gets a community's attention: a 15.52% move breaking out of a well-defined ascending channel.
The Fibonacci ladder above current price gives a genuinely useful, level-by-level way to track whether this breakout turns into a real trend or fades back into the range.
Stretching that same logic out to 2050 means accepting a wide band of outcomes rather than one confident number.
Anyone using this SPX6900 price prediction 2026-2050 breakdown should treat it as a starting point for research, not financial advice.
Meme coin markets move on sentiment as much as they do on chart structure, and that won't be any different a decade or two from now.
Disclaimer: This article is for informational purposes only and should not be considered financial advice. Cryptocurrency investments, especially in high-volatility meme coins like SPX6900, carry significant risk of loss. Always do your own research before investing.
Also read:

















